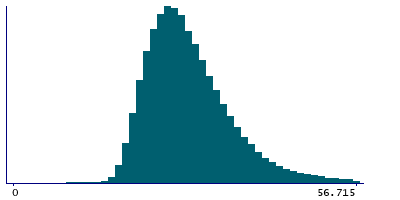
Data
503,466 items of data are available, covering 484,319 participants.
Defined-instances run from 0 to 1, labelled using Instancing
2.
Units of measurement are percent.
| Maximum | 99.949 |
| Decile 9 | 39.2817 |
| Decile 8 | 34.629 |
| Decile 7 | 31.82 |
| Decile 6 | 29.7071 |
| Median | 27.9208 |
| Decile 4 | 26.319 |
| Decile 3 | 24.7732 |
| Decile 2 | 23.159 |
| Decile 1 | 21.2082 |
| Minimum | 0.0555073 |
|
|
- Mean = 29.5367
- Std.dev = 8.39348
- 6405 items above graph maximum of 57.3553
|
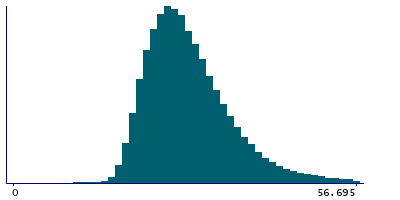
2 Instances
Instance 0 : Initial assessment visit (2006-2010) at which participants were recruited and consent given
483,759 participants, 483,759 items
| Maximum | 99.949 |
| Decile 9 | 39.303 |
| Decile 8 | 34.645 |
| Decile 7 | 31.834 |
| Decile 6 | 29.7176 |
| Median | 27.9319 |
| Decile 4 | 26.329 |
| Decile 3 | 24.783 |
| Decile 2 | 23.1692 |
| Decile 1 | 21.2185 |
| Minimum | 0.0555073 |
|
|
- Mean = 29.551
- Std.dev = 8.40374
- 6169 items above graph maximum of 57.3875
|
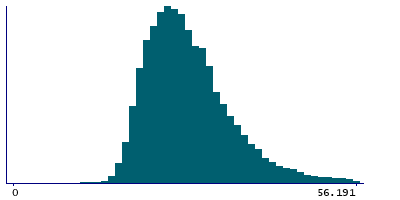
Instance 1 : First repeat assessment visit (2012-13)
19,707 participants, 19,707 items
| Maximum | 99.884 |
| Decile 9 | 38.7835 |
| Decile 8 | 34.19 |
| Decile 7 | 31.4945 |
| Decile 6 | 29.454 |
| Median | 27.6687 |
| Decile 4 | 26.058 |
| Decile 3 | 24.548 |
| Decile 2 | 22.9041 |
| Decile 1 | 20.984 |
| Minimum | 2.8244 |
|
|
- Mean = 29.1855
- Std.dev = 8.12982
- 232 items above graph maximum of 56.583
|


