Data
507,901 items of data are available, covering 488,456 participants.
Defined-instances run from 0 to 1, labelled using Instancing
2.
Units of measurement are percent.
| Maximum | 44.4005 |
| Decile 9 | 21.6114 |
| Decile 8 | 20.9769 |
| Decile 7 | 20.5432 |
| Decile 6 | 20.1786 |
| Median | 19.819 |
| Decile 4 | 19.405 |
| Decile 3 | 18.828 |
| Decile 2 | 17.8395 |
| Decile 1 | 15.6182 |
| Minimum | 0.000139701 |
|
|
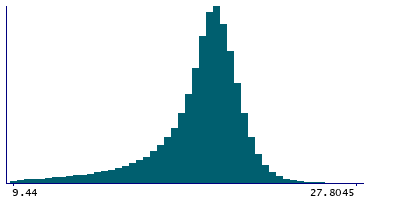
- Mean = 18.9912
- Std.dev = 3.3969
- 13949 items below graph minimum of 9.62491
- 318 items above graph maximum of 27.6046
|
2 Instances
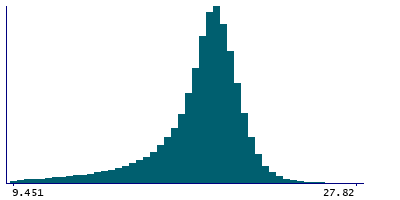
Instance 0 : Initial assessment visit (2006-2010) at which participants were recruited and consent given
488,026 participants, 488,026 items
| Maximum | 44.4005 |
| Decile 9 | 21.618 |
| Decile 8 | 20.984 |
| Decile 7 | 20.5505 |
| Decile 6 | 20.1857 |
| Median | 19.8271 |
| Decile 4 | 19.4138 |
| Decile 3 | 18.838 |
| Decile 2 | 17.849 |
| Decile 1 | 15.627 |
| Minimum | 0.000139701 |
|
|
- Mean = 18.9991
- Std.dev = 3.39776
- 13426 items below graph minimum of 9.636
- 310 items above graph maximum of 27.609
|
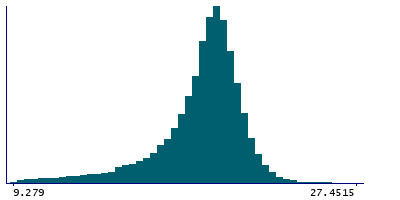
Instance 1 : First repeat assessment visit (2012-13)
19,875 participants, 19,875 items
| Maximum | 29.3036 |
| Decile 9 | 21.424 |
| Decile 8 | 20.7981 |
| Decile 7 | 20.364 |
| Decile 6 | 20.002 |
| Median | 19.6254 |
| Decile 4 | 19.204 |
| Decile 3 | 18.5955 |
| Decile 2 | 17.607 |
| Decile 1 | 15.4155 |
| Minimum | 0.00019425 |
|
|
- Mean = 18.7977
- Std.dev = 3.36999
- 524 items below graph minimum of 9.407
- 8 items above graph maximum of 27.4325
|


