Data
507,960 items of data are available, covering 488,512 participants.
Defined-instances run from 0 to 1, labelled using Instancing
2.
Units of measurement are percent.
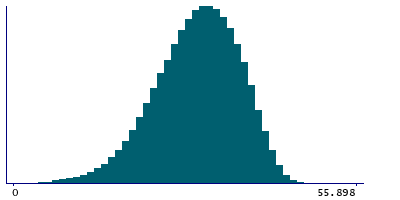
| Maximum | 65.29 |
| Decile 9 | 38.457 |
| Decile 8 | 35.9967 |
| Decile 7 | 33.989 |
| Decile 6 | 32.163 |
| Median | 30.38 |
| Decile 4 | 28.5581 |
| Decile 3 | 26.547 |
| Decile 2 | 24.142 |
| Decile 1 | 20.74 |
| Minimum | 0.300081 |
|
|
- Mean = 29.9092
- Std.dev = 6.86673
- 8 items above graph maximum of 56.1741
|
2 Instances
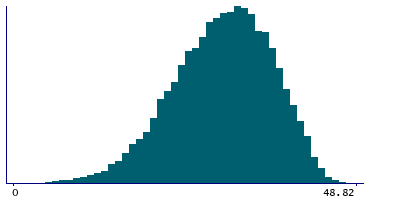
Instance 0 : Initial assessment visit (2006-2010) at which participants were recruited and consent given
488,083 participants, 488,083 items
| Maximum | 65.29 |
| Decile 9 | 38.454 |
| Decile 8 | 35.992 |
| Decile 7 | 33.99 |
| Decile 6 | 32.164 |
| Median | 30.382 |
| Decile 4 | 28.5656 |
| Decile 3 | 26.558 |
| Decile 2 | 24.154 |
| Decile 1 | 20.751 |
| Minimum | 0.300081 |
|

|
- Mean = 29.913
- Std.dev = 6.86112
- 8 items above graph maximum of 56.157
|
Instance 1 : First repeat assessment visit (2012-13)
19,877 participants, 19,877 items
| Maximum | 50.9547 |
| Decile 9 | 38.541 |
| Decile 8 | 36.0915 |
| Decile 7 | 33.973 |
| Decile 6 | 32.1495 |
| Median | 30.3245 |
| Decile 4 | 28.3835 |
| Decile 3 | 26.2875 |
| Decile 2 | 23.8675 |
| Decile 1 | 20.5125 |
| Minimum | 2.3435 |
|
|
- Mean = 29.8168
- Std.dev = 7.00243
|


