Data
507,960 items of data are available, covering 488,512 participants.
Defined-instances run from 0 to 1, labelled using Instancing
2.
Units of measurement are percent.
| Maximum | 38.974 |
| Decile 9 | 22.7395 |
| Decile 8 | 20.8518 |
| Decile 7 | 19.316 |
| Decile 6 | 17.909 |
| Median | 16.5496 |
| Decile 4 | 15.1673 |
| Decile 3 | 13.658 |
| Decile 2 | 11.865 |
| Decile 1 | 9.3301 |
| Minimum | 6.4413e-06 |
|
|
- Mean = 16.236
- Std.dev = 5.16659
- 3 items above graph maximum of 36.1488
|
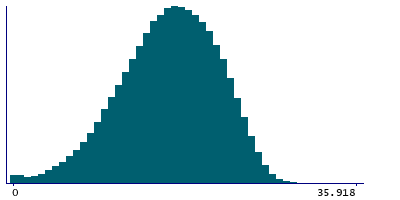
2 Instances
Instance 0 : Initial assessment visit (2006-2010) at which participants were recruited and consent given
488,083 participants, 488,083 items
| Maximum | 38.974 |
| Decile 9 | 22.7408 |
| Decile 8 | 20.852 |
| Decile 7 | 19.318 |
| Decile 6 | 17.9104 |
| Median | 16.5527 |
| Decile 4 | 15.1722 |
| Decile 3 | 13.6657 |
| Decile 2 | 11.8738 |
| Decile 1 | 9.33694 |
| Minimum | 6.4413e-06 |
|

|
- Mean = 16.2398
- Std.dev = 5.16404
- 3 items above graph maximum of 36.1447
|
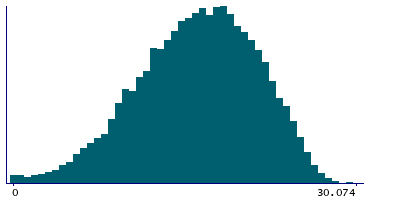
Instance 1 : First repeat assessment visit (2012-13)
19,877 participants, 19,877 items
| Maximum | 31.569 |
| Decile 9 | 22.7212 |
| Decile 8 | 20.8485 |
| Decile 7 | 19.2565 |
| Decile 6 | 17.8785 |
| Median | 16.484 |
| Decile 4 | 15.0415 |
| Decile 3 | 13.489 |
| Decile 2 | 11.684 |
| Decile 1 | 9.15618 |
| Minimum | 0.000217 |
|
|
- Mean = 16.1434
- Std.dev = 5.2281
- 1 item above graph maximum of 31.569
|


