Data
507,960 items of data are available, covering 488,512 participants.
Defined-instances run from 0 to 1, labelled using Instancing
2.
Units of measurement are percent.
| Maximum | 35.384 |
| Decile 9 | 26.349 |
| Decile 8 | 25.3997 |
| Decile 7 | 24.727 |
| Decile 6 | 24.178 |
| Median | 23.68 |
| Decile 4 | 23.1864 |
| Decile 3 | 22.645 |
| Decile 2 | 21.988 |
| Decile 1 | 21.046 |
| Minimum | 8.8937 |
|
|
- Mean = 23.6796
- Std.dev = 2.09636
- 267 items below graph minimum of 15.743
- 61 items above graph maximum of 31.652
|
2 Instances
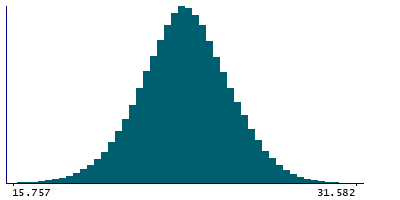
Instance 0 : Initial assessment visit (2006-2010) at which participants were recruited and consent given
488,083 participants, 488,083 items
| Maximum | 35.384 |
| Decile 9 | 26.3536 |
| Decile 8 | 25.404 |
| Decile 7 | 24.731 |
| Decile 6 | 24.1812 |
| Median | 23.683 |
| Decile 4 | 23.19 |
| Decile 3 | 22.649 |
| Decile 2 | 21.992 |
| Decile 1 | 21.05 |
| Minimum | 8.8937 |
|

|
- Mean = 23.6835
- Std.dev = 2.09767
- 257 items below graph minimum of 15.7464
- 60 items above graph maximum of 31.6571
|
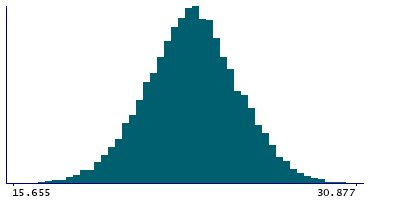
Instance 1 : First repeat assessment visit (2012-13)
19,877 participants, 19,877 items
| Maximum | 33.127 |
| Decile 9 | 26.233 |
| Decile 8 | 25.29 |
| Decile 7 | 24.624 |
| Decile 6 | 24.0914 |
| Median | 23.594 |
| Decile 4 | 23.102 |
| Decile 3 | 22.5509 |
| Decile 2 | 21.8865 |
| Decile 1 | 20.9435 |
| Minimum | 14.086 |
|
|
- Mean = 23.5852
- Std.dev = 2.06168
- 10 items below graph minimum of 15.654
- 1 item above graph maximum of 31.5225
|


