Data
507,960 items of data are available, covering 488,512 participants.
Defined-instances run from 0 to 1, labelled using Instancing
2.
Units of measurement are percent.
| Maximum | 50.164 |
| Decile 9 | 26.9996 |
| Decile 8 | 25.9156 |
| Decile 7 | 25.099 |
| Decile 6 | 24.374 |
| Median | 23.664 |
| Decile 4 | 22.935 |
| Decile 3 | 22.126 |
| Decile 2 | 21.1418 |
| Decile 1 | 19.7318 |
| Minimum | 0.514456 |
|
|
- Mean = 23.4844
- Std.dev = 2.85881
- 380 items below graph minimum of 12.464
- 12 items above graph maximum of 34.2673
|
2 Instances
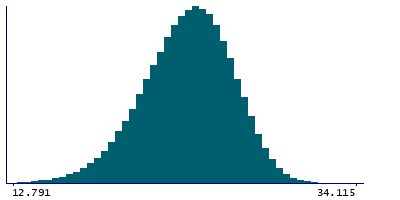
Instance 0 : Initial assessment visit (2006-2010) at which participants were recruited and consent given
488,083 participants, 488,083 items
| Maximum | 50.164 |
| Decile 9 | 27.0078 |
| Decile 8 | 25.925 |
| Decile 7 | 25.1091 |
| Decile 6 | 24.385 |
| Median | 23.675 |
| Decile 4 | 22.9464 |
| Decile 3 | 22.139 |
| Decile 2 | 21.154 |
| Decile 1 | 19.745 |
| Minimum | 0.514456 |
|

|
- Mean = 23.4952
- Std.dev = 2.85738
- 373 items below graph minimum of 12.4822
- 12 items above graph maximum of 34.2706
|
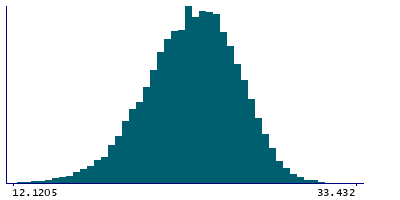
Instance 1 : First repeat assessment visit (2012-13)
19,877 participants, 19,877 items
| Maximum | 33.432 |
| Decile 9 | 26.7815 |
| Decile 8 | 25.6675 |
| Decile 7 | 24.839 |
| Decile 6 | 24.119 |
| Median | 23.374 |
| Decile 4 | 22.641 |
| Decile 3 | 21.8025 |
| Decile 2 | 20.851 |
| Decile 1 | 19.4345 |
| Minimum | 4.9385 |
|
|
- Mean = 23.2193
- Std.dev = 2.88086
- 11 items below graph minimum of 12.0875
|


