Data
507,960 items of data are available, covering 488,512 participants.
Defined-instances run from 0 to 1, labelled using Instancing
2.
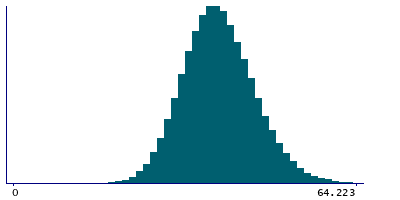
Units of measurement are percent.
| Maximum | 81.04 |
| Decile 9 | 47.326 |
| Decile 8 | 44.0467 |
| Decile 7 | 41.763 |
| Decile 6 | 39.8945 |
| Median | 38.207 |
| Decile 4 | 36.5599 |
| Decile 3 | 34.821 |
| Decile 2 | 32.826 |
| Decile 1 | 30.1231 |
| Minimum | 4.3184 |
|
|
- Mean = 38.5139
- Std.dev = 6.76107
- 209 items above graph maximum of 64.5289
|
2 Instances
Instance 0 : Initial assessment visit (2006-2010) at which participants were recruited and consent given
488,083 participants, 488,083 items
| Maximum | 81.04 |
| Decile 9 | 47.31 |
| Decile 8 | 44.026 |
| Decile 7 | 41.7408 |
| Decile 6 | 39.8727 |
| Median | 38.188 |
| Decile 4 | 36.544 |
| Decile 3 | 34.804 |
| Decile 2 | 32.809 |
| Decile 1 | 30.1068 |
| Minimum | 4.3184 |
|

|
- Mean = 38.4951
- Std.dev = 6.76184
- 201 items above graph maximum of 64.5132
|
Instance 1 : First repeat assessment visit (2012-13)
19,877 participants, 19,877 items
| Maximum | 69.973 |
| Decile 9 | 47.7235 |
| Decile 8 | 44.5992 |
| Decile 7 | 42.298 |
| Decile 6 | 40.449 |
| Median | 38.7065 |
| Decile 4 | 36.95 |
| Decile 3 | 35.2491 |
| Decile 2 | 33.3015 |
| Decile 1 | 30.5595 |
| Minimum | 13.5091 |
|

|
- Mean = 38.9746
- Std.dev = 6.72592
- 5 items above graph maximum of 64.8875
|


