Data
507,960 items of data are available, covering 488,512 participants.
Defined-instances run from 0 to 1, labelled using Instancing
2.
Units of measurement are percent.
| Maximum | 71.696 |
| Decile 9 | 56.3565 |
| Decile 8 | 54.935 |
| Decile 7 | 53.8355 |
| Decile 6 | 52.816 |
| Median | 51.773 |
| Decile 4 | 50.619 |
| Decile 3 | 49.248 |
| Decile 2 | 47.4618 |
| Decile 1 | 44.688 |
| Minimum | 16.5448 |
|

|
- Mean = 51.0563
- Std.dev = 4.74779
- 1299 items below graph minimum of 33.0195
- 6 items above graph maximum of 68.0249
|
2 Instances
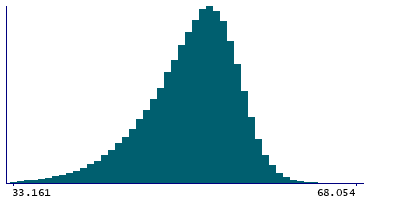
Instance 0 : Initial assessment visit (2006-2010) at which participants were recruited and consent given
488,083 participants, 488,083 items
| Maximum | 71.696 |
| Decile 9 | 56.363 |
| Decile 8 | 54.942 |
| Decile 7 | 53.8412 |
| Decile 6 | 52.823 |
| Median | 51.781 |
| Decile 4 | 50.6275 |
| Decile 3 | 49.2595 |
| Decile 2 | 47.474 |
| Decile 1 | 44.6994 |
| Minimum | 16.5448 |
|
|
- Mean = 51.0642
- Std.dev = 4.7485
- 1260 items below graph minimum of 33.0358
- 6 items above graph maximum of 68.0266
|
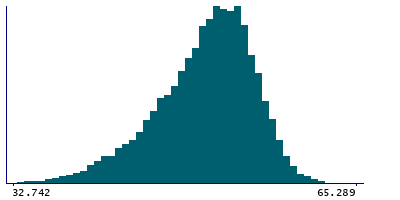
Instance 1 : First repeat assessment visit (2012-13)
19,877 participants, 19,877 items
| Maximum | 66.0348 |
| Decile 9 | 56.196 |
| Decile 8 | 54.7525 |
| Decile 7 | 53.6975 |
| Decile 6 | 52.6345 |
| Median | 51.571 |
| Decile 4 | 50.4084 |
| Decile 3 | 48.9962 |
| Decile 2 | 47.148 |
| Decile 1 | 44.468 |
| Minimum | 22.977 |
|
|
- Mean = 50.8624
- Std.dev = 4.7261
- 45 items below graph minimum of 32.74
|


