Data
507,960 items of data are available, covering 488,512 participants.
Defined-instances run from 0 to 1, labelled using Instancing
2.
Units of measurement are percent.
| Maximum | 54.209 |
| Decile 9 | 39.902 |
| Decile 8 | 38.571 |
| Decile 7 | 37.5427 |
| Decile 6 | 36.6007 |
| Median | 35.6429 |
| Decile 4 | 34.5899 |
| Decile 3 | 33.3496 |
| Decile 2 | 31.739 |
| Decile 1 | 29.2747 |
| Minimum | 5.2951 |
|
|
- Mean = 35.0402
- Std.dev = 4.29462
- 1062 items below graph minimum of 18.6474
- 9 items above graph maximum of 50.5293
|
2 Instances
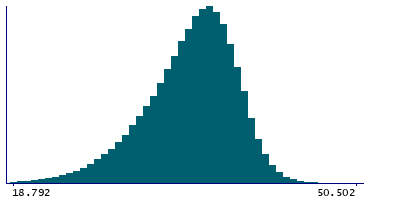
Instance 0 : Initial assessment visit (2006-2010) at which participants were recruited and consent given
488,083 participants, 488,083 items
| Maximum | 54.209 |
| Decile 9 | 39.9104 |
| Decile 8 | 38.582 |
| Decile 7 | 37.5523 |
| Decile 6 | 36.61 |
| Median | 35.6527 |
| Decile 4 | 34.601 |
| Decile 3 | 33.361 |
| Decile 2 | 31.7533 |
| Decile 1 | 29.2854 |
| Minimum | 5.2951 |
|

|
- Mean = 35.0506
- Std.dev = 4.29554
- 1028 items below graph minimum of 18.6604
- 9 items above graph maximum of 50.5355
|
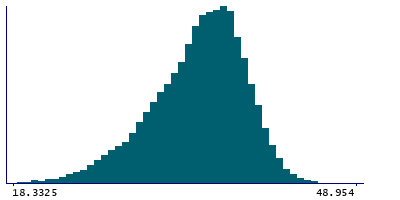
Instance 1 : First repeat assessment visit (2012-13)
19,877 participants, 19,877 items
| Maximum | 48.954 |
| Decile 9 | 39.647 |
| Decile 8 | 38.311 |
| Decile 7 | 37.3181 |
| Decile 6 | 36.3485 |
| Median | 35.381 |
| Decile 4 | 34.3245 |
| Decile 3 | 33.0629 |
| Decile 2 | 31.407 |
| Decile 1 | 28.994 |
| Minimum | 10.091 |
|
|
- Mean = 34.7843
- Std.dev = 4.26384
- 37 items below graph minimum of 18.341
|


