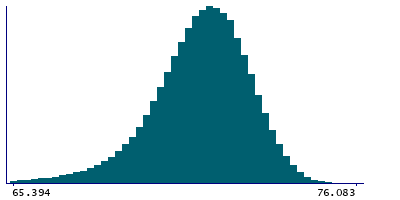
Data
507,960 items of data are available, covering 488,512 participants.
Defined-instances run from 0 to 1, labelled using Instancing
2.
Units of measurement are percent.
| Maximum | 76.1728 |
| Decile 9 | 73.0496 |
| Decile 8 | 72.5169 |
| Decile 7 | 72.117 |
| Decile 6 | 71.7608 |
| Median | 71.414 |
| Decile 4 | 71.052 |
| Decile 3 | 70.642 |
| Decile 2 | 70.1226 |
| Decile 1 | 69.293 |
| Minimum | 0 |
|
|
- Mean = 71.2101
- Std.dev = 1.88846
- 4318 items below graph minimum of 65.5365
|
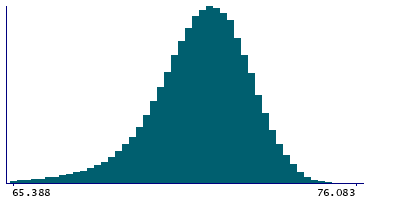
2 Instances
Instance 0 : Initial assessment visit (2006-2010) at which participants were recruited and consent given
488,083 participants, 488,083 items
| Maximum | 76.1728 |
| Decile 9 | 73.0519 |
| Decile 8 | 72.5188 |
| Decile 7 | 72.1186 |
| Decile 6 | 71.7622 |
| Median | 71.416 |
| Decile 4 | 71.053 |
| Decile 3 | 70.643 |
| Decile 2 | 70.125 |
| Decile 1 | 69.294 |
| Minimum | 0 |
|
|
- Mean = 71.2111
- Std.dev = 1.89401
- 4178 items below graph minimum of 65.5362
|
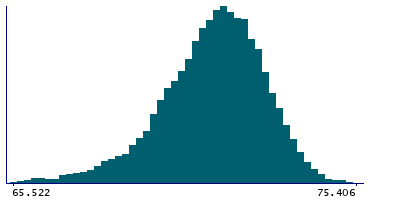
Instance 1 : First repeat assessment visit (2012-13)
19,877 participants, 19,877 items
| Maximum | 76.0689 |
| Decile 9 | 73.001 |
| Decile 8 | 72.472 |
| Decile 7 | 72.082 |
| Decile 6 | 71.718 |
| Median | 71.3793 |
| Decile 4 | 71.018 |
| Decile 3 | 70.609 |
| Decile 2 | 70.0605 |
| Decile 1 | 69.2645 |
| Minimum | 15.629 |
|
|
- Mean = 71.1852
- Std.dev = 1.74646
- 138 items below graph minimum of 65.528
|


