Data
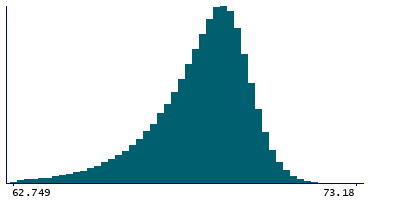
507,960 items of data are available, covering 488,512 participants.
Defined-instances run from 0 to 1, labelled using Instancing
2.
Units of measurement are percent.
| Maximum | 73.18 |
| Decile 9 | 69.9953 |
| Decile 8 | 69.5901 |
| Decile 7 | 69.2822 |
| Decile 6 | 68.997 |
| Median | 68.703 |
| Decile 4 | 68.366 |
| Decile 3 | 67.956 |
| Decile 2 | 67.3855 |
| Decile 1 | 66.443 |
| Minimum | 1.00019e-10 |
|
|
- Mean = 68.3935
- Std.dev = 1.68615
- 4263 items below graph minimum of 62.8907
|
2 Instances
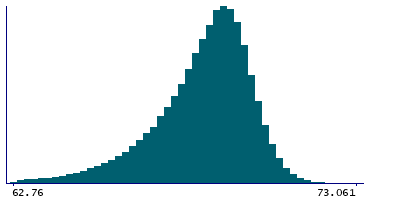
Instance 0 : Initial assessment visit (2006-2010) at which participants were recruited and consent given
488,083 participants, 488,083 items
| Maximum | 73.061 |
| Decile 9 | 69.9882 |
| Decile 8 | 69.584 |
| Decile 7 | 69.278 |
| Decile 6 | 68.994 |
| Median | 68.701 |
| Decile 4 | 68.3653 |
| Decile 3 | 67.9568 |
| Decile 2 | 67.388 |
| Decile 1 | 66.445 |
| Minimum | 1.00019e-10 |
|
|
- Mean = 68.3907
- Std.dev = 1.68793
- 4159 items below graph minimum of 62.9018
|
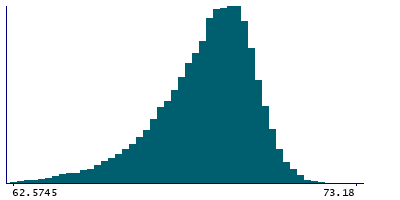
Instance 1 : First repeat assessment visit (2012-13)
19,877 participants, 19,877 items
| Maximum | 73.18 |
| Decile 9 | 70.169 |
| Decile 8 | 69.742 |
| Decile 7 | 69.413 |
| Decile 6 | 69.085 |
| Median | 68.756 |
| Decile 4 | 68.39 |
| Decile 3 | 67.936 |
| Decile 2 | 67.3345 |
| Decile 1 | 66.3885 |
| Minimum | 46.167 |
|
|
- Mean = 68.4605
- Std.dev = 1.64036
- 121 items below graph minimum of 62.608
|


