Data
507,960 items of data are available, covering 488,512 participants.
Defined-instances run from 0 to 1, labelled using Instancing
2.
Units of measurement are percent.
| Maximum | 50.404 |
| Decile 9 | 21.5147 |
| Decile 8 | 20.8218 |
| Decile 7 | 20.3134 |
| Decile 6 | 19.876 |
| Median | 19.4589 |
| Decile 4 | 19.023 |
| Decile 3 | 18.5248 |
| Decile 2 | 17.8755 |
| Decile 1 | 16.836 |
| Minimum | 5.93372e-11 |
|
|
- Mean = 19.2641
- Std.dev = 1.96632
- 2534 items below graph minimum of 12.1574
- 5 items above graph maximum of 26.1934
|
2 Instances
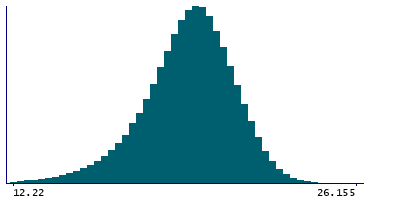
Instance 0 : Initial assessment visit (2006-2010) at which participants were recruited and consent given
488,083 participants, 488,083 items
| Maximum | 50.404 |
| Decile 9 | 21.5213 |
| Decile 8 | 20.829 |
| Decile 7 | 20.319 |
| Decile 6 | 19.881 |
| Median | 19.462 |
| Decile 4 | 19.0249 |
| Decile 3 | 18.5247 |
| Decile 2 | 17.8739 |
| Decile 1 | 16.8308 |
| Minimum | 5.93372e-11 |
|

|
- Mean = 19.266
- Std.dev = 1.97191
- 2443 items below graph minimum of 12.1404
- 5 items above graph maximum of 26.2117
|
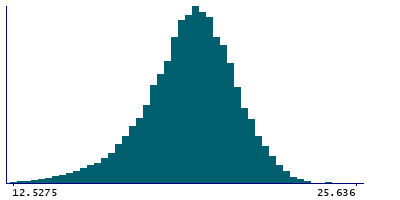
Instance 1 : First repeat assessment visit (2012-13)
19,877 participants, 19,877 items
| Maximum | 25.636 |
| Decile 9 | 21.3235 |
| Decile 8 | 20.6575 |
| Decile 7 | 20.1715 |
| Decile 6 | 19.7701 |
| Median | 19.3826 |
| Decile 4 | 18.973 |
| Decile 3 | 18.527 |
| Decile 2 | 17.922 |
| Decile 1 | 16.959 |
| Minimum | 0.62552 |
|
|
- Mean = 19.2181
- Std.dev = 1.8231
- 85 items below graph minimum of 12.5945
|


