Data
507,960 items of data are available, covering 488,512 participants.
Defined-instances run from 0 to 1, labelled using Instancing
2.
Units of measurement are percent.
| Maximum | 77.593 |
| Decile 9 | 7.7752 |
| Decile 8 | 6.6585 |
| Decile 7 | 5.9951 |
| Decile 6 | 5.5052 |
| Median | 5.1121 |
| Decile 4 | 4.76842 |
| Decile 3 | 4.44604 |
| Decile 2 | 4.116 |
| Decile 1 | 3.72548 |
| Minimum | 1.6825 |
|

|
- Mean = 5.51422
- Std.dev = 1.84013
- 4844 items above graph maximum of 11.8249
|
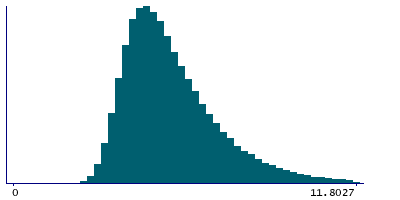
2 Instances
Instance 0 : Initial assessment visit (2006-2010) at which participants were recruited and consent given
488,083 participants, 488,083 items
| Maximum | 77.593 |
| Decile 9 | 7.78279 |
| Decile 8 | 6.66103 |
| Decile 7 | 5.9956 |
| Decile 6 | 5.5042 |
| Median | 5.11086 |
| Decile 4 | 4.7661 |
| Decile 3 | 4.4429 |
| Decile 2 | 4.1129 |
| Decile 1 | 3.72202 |
| Minimum | 1.6825 |
|
|
- Mean = 5.51478
- Std.dev = 1.8466
- 4672 items above graph maximum of 11.8436
|
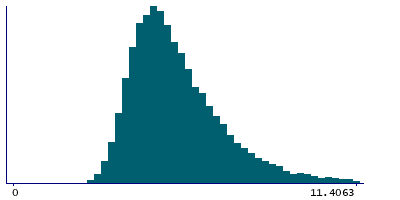
Instance 1 : First repeat assessment visit (2012-13)
19,877 participants, 19,877 items
| Maximum | 30.931 |
| Decile 9 | 7.624 |
| Decile 8 | 6.5958 |
| Decile 7 | 5.98311 |
| Decile 6 | 5.52695 |
| Median | 5.14515 |
| Decile 4 | 4.8217 |
| Decile 3 | 4.516 |
| Decile 2 | 4.1949 |
| Decile 1 | 3.8088 |
| Minimum | 2.1654 |
|
|
- Mean = 5.50053
- Std.dev = 1.67326
- 151 items above graph maximum of 11.4392
|


