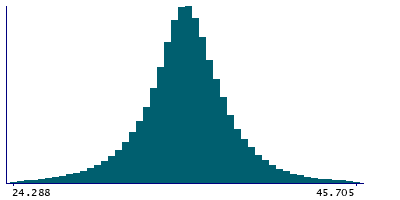
Data
507,721 items of data are available, covering 488,283 participants.
Defined-instances run from 0 to 1, labelled using Instancing
2.
Units of measurement are percent.
| Maximum | 80.555 |
| Decile 9 | 38.8097 |
| Decile 8 | 37.321 |
| Decile 7 | 36.4405 |
| Decile 6 | 35.7754 |
| Median | 35.19 |
| Decile 4 | 34.6155 |
| Decile 3 | 33.966 |
| Decile 2 | 33.087 |
| Decile 1 | 31.5178 |
| Minimum | 4.8358e-05 |
|

|
- Mean = 35.1581
- Std.dev = 3.68032
- 4065 items below graph minimum of 24.2259
- 3848 items above graph maximum of 46.1017
|
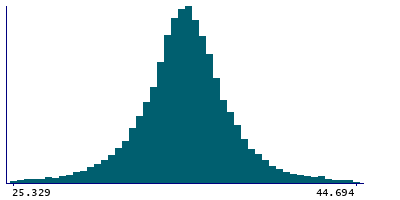
2 Instances
Instance 0 : Initial assessment visit (2006-2010) at which participants were recruited and consent given
487,850 participants, 487,850 items
| Maximum | 80.555 |
| Decile 9 | 38.828 |
| Decile 8 | 37.334 |
| Decile 7 | 36.45 |
| Decile 6 | 35.782 |
| Median | 35.195 |
| Decile 4 | 34.6187 |
| Decile 3 | 33.9664 |
| Decile 2 | 33.084 |
| Decile 1 | 31.5061 |
| Minimum | 4.8358e-05 |
|
|
- Mean = 35.1612
- Std.dev = 3.69368
- 3913 items below graph minimum of 24.1842
- 3681 items above graph maximum of 46.1499
|
Instance 1 : First repeat assessment visit (2012-13)
19,871 participants, 19,871 items
| Maximum | 69.988 |
| Decile 9 | 38.341 |
| Decile 8 | 37.001 |
| Decile 7 | 36.2255 |
| Decile 6 | 35.62 |
| Median | 35.086 |
| Decile 4 | 34.552 |
| Decile 3 | 33.9588 |
| Decile 2 | 33.1555 |
| Decile 1 | 31.792 |
| Minimum | 6.727e-05 |
|
|
- Mean = 35.0819
- Std.dev = 3.33482
- 134 items below graph minimum of 25.243
- 171 items above graph maximum of 44.89
|


