Data
507,960 items of data are available, covering 488,512 participants.
Defined-instances run from 0 to 1, labelled using Instancing
2.
Units of measurement are percent.
| Maximum | 72.995 |
| Decile 9 | 49.3079 |
| Decile 8 | 48.246 |
| Decile 7 | 47.2057 |
| Decile 6 | 46.158 |
| Median | 45.0399 |
| Decile 4 | 43.7579 |
| Decile 3 | 42.176 |
| Decile 2 | 39.981 |
| Decile 1 | 36.3362 |
| Minimum | 3.1875e-05 |
|
|
- Mean = 43.6583
- Std.dev = 5.81522
- 5189 items below graph minimum of 23.3645
- 2 items above graph maximum of 62.2795
|
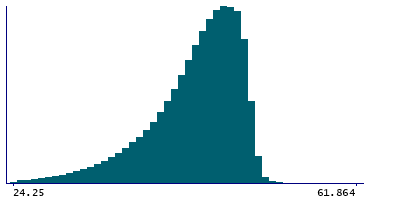
2 Instances
Instance 0 : Initial assessment visit (2006-2010) at which participants were recruited and consent given
488,083 participants, 488,083 items
| Maximum | 72.995 |
| Decile 9 | 49.296 |
| Decile 8 | 48.227 |
| Decile 7 | 47.185 |
| Decile 6 | 46.132 |
| Median | 45.01 |
| Decile 4 | 43.7255 |
| Decile 3 | 42.1368 |
| Decile 2 | 39.9386 |
| Decile 1 | 36.292 |
| Minimum | 3.1875e-05 |
|

|
- Mean = 43.628
- Std.dev = 5.82926
- 4978 items below graph minimum of 23.288
- 2 items above graph maximum of 62.3
|
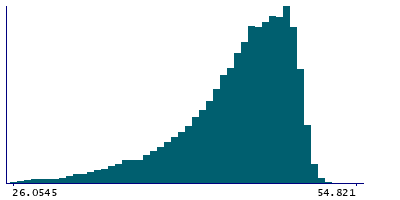
Instance 1 : First repeat assessment visit (2012-13)
19,877 participants, 19,877 items
| Maximum | 54.821 |
| Decile 9 | 49.555 |
| Decile 8 | 48.6596 |
| Decile 7 | 47.708 |
| Decile 6 | 46.7315 |
| Median | 45.7305 |
| Decile 4 | 44.547 |
| Decile 3 | 43.086 |
| Decile 2 | 41.091 |
| Decile 1 | 37.5821 |
| Minimum | 0.0082787 |
|
|
- Mean = 44.403
- Std.dev = 5.406
- 214 items below graph minimum of 25.6093
|


