Data
507,960 items of data are available, covering 488,512 participants.
Defined-instances run from 0 to 1, labelled using Instancing
2.
Units of measurement are percent.
| Maximum | 65.293 |
| Decile 9 | 38.5562 |
| Decile 8 | 37.709 |
| Decile 7 | 36.836 |
| Decile 6 | 35.94 |
| Median | 34.979 |
| Decile 4 | 33.852 |
| Decile 3 | 32.444 |
| Decile 2 | 30.463 |
| Decile 1 | 27.1557 |
| Minimum | 1.263e-05 |
|

|
- Mean = 33.7102
- Std.dev = 5.03445
- 4673 items below graph minimum of 15.7552
- 2 items above graph maximum of 49.9567
|
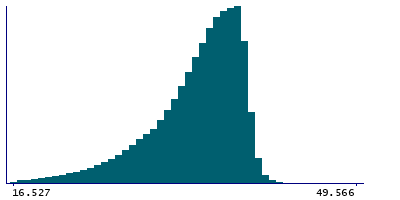
2 Instances
Instance 0 : Initial assessment visit (2006-2010) at which participants were recruited and consent given
488,083 participants, 488,083 items
| Maximum | 65.293 |
| Decile 9 | 38.5483 |
| Decile 8 | 37.696 |
| Decile 7 | 36.8197 |
| Decile 6 | 35.92 |
| Median | 34.9536 |
| Decile 4 | 33.821 |
| Decile 3 | 32.4084 |
| Decile 2 | 30.421 |
| Decile 1 | 27.1101 |
| Minimum | 1.263e-05 |
|
|
- Mean = 33.6832
- Std.dev = 5.04944
- 4466 items below graph minimum of 15.672
- 2 items above graph maximum of 49.9865
|
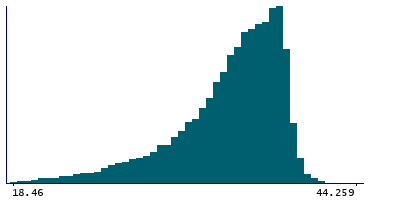
Instance 1 : First repeat assessment visit (2012-13)
19,877 participants, 19,877 items
| Maximum | 44.259 |
| Decile 9 | 38.7067 |
| Decile 8 | 37.991 |
| Decile 7 | 37.205 |
| Decile 6 | 36.3895 |
| Median | 35.5389 |
| Decile 4 | 34.559 |
| Decile 3 | 33.322 |
| Decile 2 | 31.541 |
| Decile 1 | 28.3785 |
| Minimum | 7.2516e-05 |
|
|
- Mean = 34.3712
- Std.dev = 4.60185
- 192 items below graph minimum of 18.0503
|


