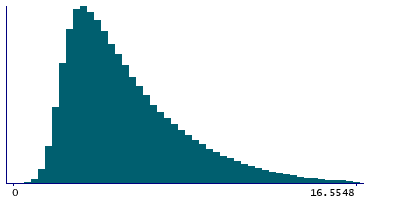
Data
507,960 items of data are available, covering 488,512 participants.
Defined-instances run from 0 to 1, labelled using Instancing
2.
Units of measurement are percent.
| Maximum | 100 |
| Decile 9 | 9.7181 |
| Decile 8 | 7.6698 |
| Decile 7 | 6.40627 |
| Decile 6 | 5.49679 |
| Median | 4.7766 |
| Decile 4 | 4.16794 |
| Decile 3 | 3.62824 |
| Decile 2 | 3.1185 |
| Decile 1 | 2.57071 |
| Minimum | 0.00026614 |
|
|
- Mean = 5.6389
- Std.dev = 3.49567
- 5158 items above graph maximum of 16.8655
|
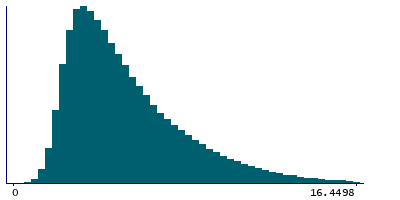
2 Instances
Instance 0 : Initial assessment visit (2006-2010) at which participants were recruited and consent given
488,083 participants, 488,083 items
| Maximum | 100 |
| Decile 9 | 9.76084 |
| Decile 8 | 7.70255 |
| Decile 7 | 6.43333 |
| Decile 6 | 5.51878 |
| Median | 4.7937 |
| Decile 4 | 4.1793 |
| Decile 3 | 3.6356 |
| Decile 2 | 3.1234 |
| Decile 1 | 2.57215 |
| Minimum | 0.00026614 |
|
|
- Mean = 5.65871
- Std.dev = 3.51553
- 4938 items above graph maximum of 16.9495
|
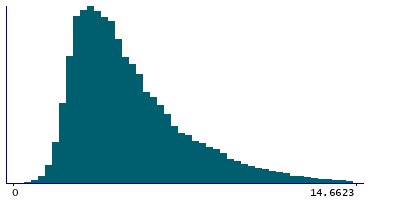
Instance 1 : First repeat assessment visit (2012-13)
19,877 participants, 19,877 items
| Maximum | 98.314 |
| Decile 9 | 8.67613 |
| Decile 8 | 6.83491 |
| Decile 7 | 5.8012 |
| Decile 6 | 5.0345 |
| Median | 4.42345 |
| Decile 4 | 3.92365 |
| Decile 3 | 3.46045 |
| Decile 2 | 3.0101 |
| Decile 1 | 2.53755 |
| Minimum | 0.61952 |
|
|
- Mean = 5.15258
- Std.dev = 2.92489
- 194 items above graph maximum of 14.8147
|


