Data
507,960 items of data are available, covering 488,512 participants.
Defined-instances run from 0 to 1, labelled using Instancing
2.
Units of measurement are percent.
| Maximum | 65.2073 |
| Decile 9 | 48.865 |
| Decile 8 | 48.138 |
| Decile 7 | 47.635 |
| Decile 6 | 47.233 |
| Median | 46.887 |
| Decile 4 | 46.5769 |
| Decile 3 | 46.285 |
| Decile 2 | 45.9799 |
| Decile 1 | 45.577 |
| Minimum | 0.05717 |
|
|
- Mean = 47.0695
- Std.dev = 1.32007
- 4 items below graph minimum of 42.289
- 577 items above graph maximum of 52.153
|
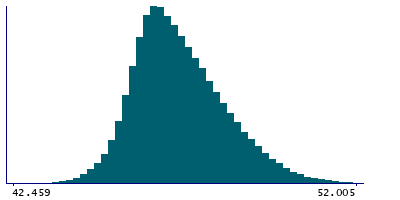
2 Instances
Instance 0 : Initial assessment visit (2006-2010) at which participants were recruited and consent given
488,083 participants, 488,083 items
| Maximum | 65.2073 |
| Decile 9 | 48.873 |
| Decile 8 | 48.1462 |
| Decile 7 | 47.641 |
| Decile 6 | 47.2385 |
| Median | 46.8913 |
| Decile 4 | 46.58 |
| Decile 3 | 46.288 |
| Decile 2 | 45.9821 |
| Decile 1 | 45.5802 |
| Minimum | 0.05717 |
|

|
- Mean = 47.0748
- Std.dev = 1.3221
- 4 items below graph minimum of 42.2874
- 553 items above graph maximum of 52.1658
|
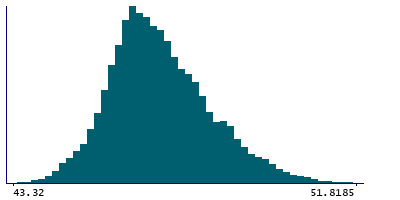
Instance 1 : First repeat assessment visit (2012-13)
19,877 participants, 19,877 items
| Maximum | 54.189 |
| Decile 9 | 48.6605 |
| Decile 8 | 47.9428 |
| Decile 7 | 47.483 |
| Decile 6 | 47.1 |
| Median | 46.7779 |
| Decile 4 | 46.488 |
| Decile 3 | 46.214 |
| Decile 2 | 45.911 |
| Decile 1 | 45.488 |
| Minimum | 42.8264 |
|
|
- Mean = 46.9391
- Std.dev = 1.2624
- 20 items above graph maximum of 51.833
|


