Data
507,960 items of data are available, covering 488,512 participants.
Defined-instances run from 0 to 1, labelled using Instancing
2.
Units of measurement are percent.
| Maximum | 13.586 |
| Decile 9 | 9.2236 |
| Decile 8 | 8.9212 |
| Decile 7 | 8.7056 |
| Decile 6 | 8.5253 |
| Median | 8.35891 |
| Decile 4 | 8.19278 |
| Decile 3 | 8.0147 |
| Decile 2 | 7.8037 |
| Decile 1 | 7.4977 |
| Minimum | 0.00032001 |
|

|
- Mean = 8.35422
- Std.dev = 0.689691
- 569 items below graph minimum of 5.7718
- 50 items above graph maximum of 10.9495
|
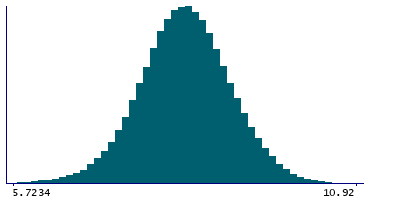
2 Instances
Instance 0 : Initial assessment visit (2006-2010) at which participants were recruited and consent given
488,083 participants, 488,083 items
| Maximum | 13.586 |
| Decile 9 | 9.21885 |
| Decile 8 | 8.91685 |
| Decile 7 | 8.702 |
| Decile 6 | 8.5221 |
| Median | 8.3559 |
| Decile 4 | 8.1905 |
| Decile 3 | 8.01282 |
| Decile 2 | 7.80208 |
| Decile 1 | 7.4962 |
| Minimum | 0.00032001 |
|
|
- Mean = 8.35123
- Std.dev = 0.688654
- 557 items below graph minimum of 5.77355
- 49 items above graph maximum of 10.9415
|
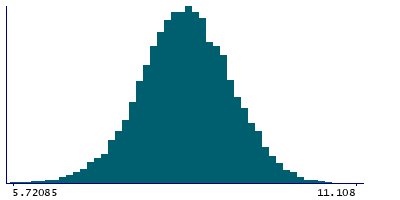
Instance 1 : First repeat assessment visit (2012-13)
19,877 participants, 19,877 items
| Maximum | 11.108 |
| Decile 9 | 9.3356 |
| Decile 8 | 9.02424 |
| Decile 7 | 8.7991 |
| Decile 6 | 8.60894 |
| Median | 8.436 |
| Decile 4 | 8.25225 |
| Decile 3 | 8.06825 |
| Decile 2 | 7.8486 |
| Decile 1 | 7.53895 |
| Minimum | 3.5569 |
|
|
- Mean = 8.42764
- Std.dev = 0.710744
- 14 items below graph minimum of 5.7423
|


