Data
507,960 items of data are available, covering 488,512 participants.
Defined-instances run from 0 to 1, labelled using Instancing
2.
Units of measurement are percent.
| Maximum | 67.3694 |
| Decile 9 | 58.6118 |
| Decile 8 | 58.043 |
| Decile 7 | 57.6508 |
| Decile 6 | 57.32 |
| Median | 57.0172 |
| Decile 4 | 56.716 |
| Decile 3 | 56.3949 |
| Decile 2 | 56.0189 |
| Decile 1 | 55.489 |
| Minimum | 47.7579 |
|

|
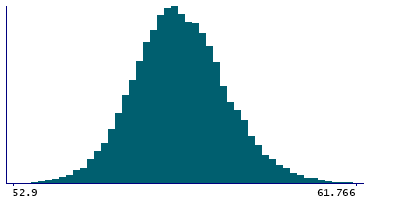
- Mean = 57.0408
- Std.dev = 1.23807
- 54 items below graph minimum of 52.3662
- 352 items above graph maximum of 61.7346
|
2 Instances
Instance 0 : Initial assessment visit (2006-2010) at which participants were recruited and consent given
488,083 participants, 488,083 items
| Maximum | 67.3694 |
| Decile 9 | 58.606 |
| Decile 8 | 58.0378 |
| Decile 7 | 57.645 |
| Decile 6 | 57.3145 |
| Median | 57.0119 |
| Decile 4 | 56.71 |
| Decile 3 | 56.388 |
| Decile 2 | 56.011 |
| Decile 1 | 55.481 |
| Minimum | 47.7579 |
|

|
- Mean = 57.0345
- Std.dev = 1.23941
- 52 items below graph minimum of 52.356
- 346 items above graph maximum of 61.731
|
Instance 1 : First repeat assessment visit (2012-13)
19,877 participants, 19,877 items
| Maximum | 62.423 |
| Decile 9 | 58.739 |
| Decile 8 | 58.1652 |
| Decile 7 | 57.79 |
| Decile 6 | 57.456 |
| Median | 57.15 |
| Decile 4 | 56.864 |
| Decile 3 | 56.5571 |
| Decile 2 | 56.206 |
| Decile 1 | 55.713 |
| Minimum | 52.0158 |
|
|
- Mean = 57.1961
- Std.dev = 1.19426
- 1 item below graph minimum of 52.687
- 8 items above graph maximum of 61.765
|


