Data
457,927 items of data are available, covering 210,739 participants.
Defined-instances run from 0 to 4, labelled using Instancing
1.
Units of measurement are kj.
| Maximum | 20882.4 |
| Decile 9 | 2620.72 |
| Decile 8 | 1983.62 |
| Decile 7 | 1602.92 |
| Decile 6 | 1319.24 |
| Median | 1081.39 |
| Decile 4 | 866.65 |
| Decile 3 | 668.3 |
| Decile 2 | 471.495 |
| Decile 1 | 277.701 |
| Minimum | 0 |
|

|
- Mean = 1309.78
- Std.dev = 1020.06
- 3941 items above graph maximum of 4963.75
|
5 Instances
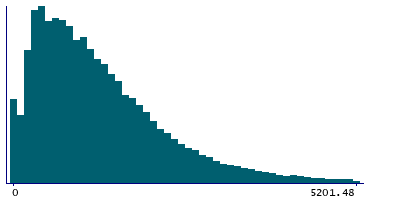
Instance 0 : Conducted in assessment centre, April 2009 to September 2010.
70,630 participants, 70,630 items
| Maximum | 18771.1 |
| Decile 9 | 2739.6 |
| Decile 8 | 2048.06 |
| Decile 7 | 1646.5 |
| Decile 6 | 1344.79 |
| Median | 1093 |
| Decile 4 | 866.85 |
| Decile 3 | 665.45 |
| Decile 2 | 466.037 |
| Decile 1 | 277.701 |
| Minimum | 0 |
|
|
- Mean = 1348.33
- Std.dev = 1084.51
- 599 items above graph maximum of 5201.5
|
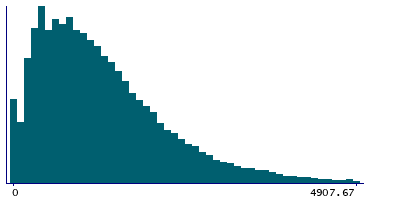
Instance 1 : On-line cycle 1, February 2011 to April 2011.
100,447 participants, 100,447 items
| Maximum | 11792.1 |
| Decile 9 | 2593.22 |
| Decile 8 | 1971.56 |
| Decile 7 | 1594.06 |
| Decile 6 | 1318.71 |
| Median | 1082.99 |
| Decile 4 | 870.074 |
| Decile 3 | 672.113 |
| Decile 2 | 475.101 |
| Decile 1 | 278.24 |
| Minimum | 0 |
|
|
- Mean = 1302.31
- Std.dev = 999.712
- 847 items above graph maximum of 4908.19
|
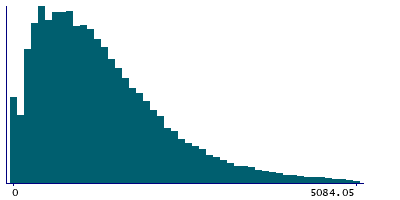
Instance 2 : On-line cycle 2, June 2011 to September 2011.
83,140 participants, 83,140 items
| Maximum | 19151.5 |
| Decile 9 | 2686.31 |
| Decile 8 | 2039.95 |
| Decile 7 | 1654.68 |
| Decile 6 | 1366.92 |
| Median | 1126.3 |
| Decile 4 | 903.751 |
| Decile 3 | 702.373 |
| Decile 2 | 496.852 |
| Decile 1 | 288.21 |
| Minimum | 0 |
|
|
- Mean = 1351.31
- Std.dev = 1040.35
- 703 items above graph maximum of 5084.41
|
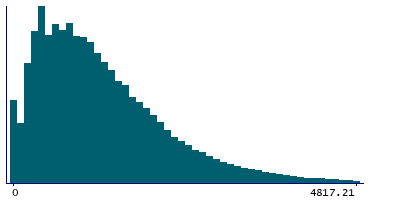
Instance 3 : On-line cycle 3, October 2011 to December 2011.
103,616 participants, 103,616 items
| Maximum | 10974.8 |
| Decile 9 | 2545.82 |
| Decile 8 | 1934.42 |
| Decile 7 | 1568.03 |
| Decile 6 | 1286.48 |
| Median | 1055.34 |
| Decile 4 | 849.543 |
| Decile 3 | 655.278 |
| Decile 2 | 460.65 |
| Decile 1 | 274.75 |
| Minimum | 0 |
|
|
- Mean = 1275.88
- Std.dev = 986.428
- 891 items above graph maximum of 4816.89
|
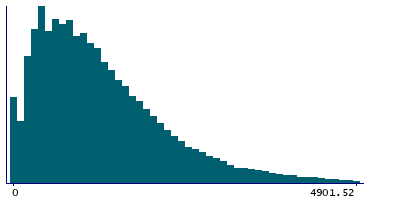
Instance 4 : On-line cycle 4, April 2012 to June 2012.
100,094 participants, 100,094 items
| Maximum | 20882.4 |
| Decile 9 | 2586.74 |
| Decile 8 | 1957.24 |
| Decile 7 | 1583.07 |
| Decile 6 | 1298.33 |
| Median | 1063.96 |
| Decile 4 | 854.403 |
| Decile 3 | 659.123 |
| Decile 2 | 463.65 |
| Decile 1 | 272.025 |
| Minimum | 0 |
|
|
- Mean = 1290.66
- Std.dev = 1008.51
- 856 items above graph maximum of 4901.45
|
