Data
457,927 items of data are available, covering 210,739 participants.
Defined-instances run from 0 to 4, labelled using Instancing
1.
Units of measurement are g.
| Maximum | 573.196 |
| Decile 9 | 82.7765 |
| Decile 8 | 69.7039 |
| Decile 7 | 61.7183 |
| Decile 6 | 55.8022 |
| Median | 50.6485 |
| Decile 4 | 45.5344 |
| Decile 3 | 39.649 |
| Decile 2 | 32.1657 |
| Decile 1 | 22.776 |
| Minimum | 0 |
|
|
- Mean = 52.4708
- Std.dev = 24.9717
- 2459 items above graph maximum of 142.777
|
5 Instances
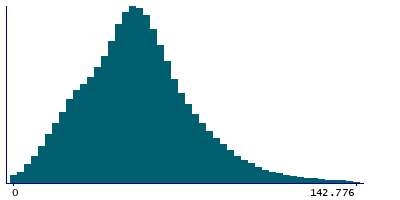
Instance 0 : Conducted in assessment centre, April 2009 to September 2010.
70,630 participants, 70,630 items
| Maximum | 546.95 |
| Decile 9 | 82.7212 |
| Decile 8 | 69.2378 |
| Decile 7 | 60.944 |
| Decile 6 | 54.8893 |
| Median | 49.6575 |
| Decile 4 | 44.2771 |
| Decile 3 | 38.1717 |
| Decile 2 | 30.5319 |
| Decile 1 | 21.3087 |
| Minimum | 0 |
|
|
- Mean = 51.5729
- Std.dev = 25.6511
- 411 items above graph maximum of 144.134
|
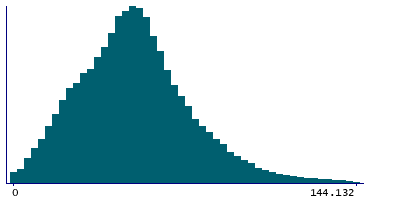
Instance 1 : On-line cycle 1, February 2011 to April 2011.
100,447 participants, 100,447 items
| Maximum | 466.381 |
| Decile 9 | 82.6474 |
| Decile 8 | 69.9295 |
| Decile 7 | 62.0997 |
| Decile 6 | 56.2307 |
| Median | 51.0947 |
| Decile 4 | 46.0586 |
| Decile 3 | 40.2839 |
| Decile 2 | 32.7246 |
| Decile 1 | 23.3239 |
| Minimum | 0 |
|
|
- Mean = 52.8031
- Std.dev = 24.6877
- 526 items above graph maximum of 141.971
|
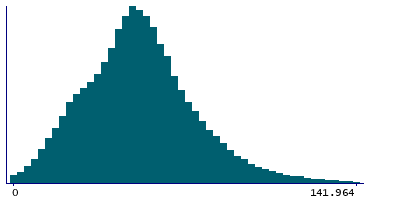
Instance 2 : On-line cycle 2, June 2011 to September 2011.
83,140 participants, 83,140 items
| Maximum | 573.196 |
| Decile 9 | 83.4731 |
| Decile 8 | 70.074 |
| Decile 7 | 62.0275 |
| Decile 6 | 55.95 |
| Median | 50.7229 |
| Decile 4 | 45.5853 |
| Decile 3 | 39.6796 |
| Decile 2 | 32.3355 |
| Decile 1 | 23.084 |
| Minimum | 0 |
|

|
- Mean = 52.8229
- Std.dev = 25.396
- 484 items above graph maximum of 143.862
|
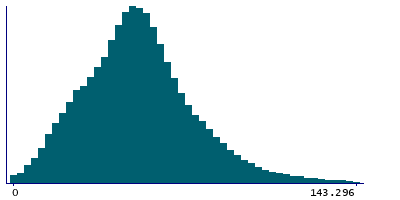
Instance 3 : On-line cycle 3, October 2011 to December 2011.
103,616 participants, 103,616 items
| Maximum | 429.519 |
| Decile 9 | 81.8489 |
| Decile 8 | 69.1186 |
| Decile 7 | 61.2914 |
| Decile 6 | 55.5092 |
| Median | 50.4839 |
| Decile 4 | 45.4683 |
| Decile 3 | 39.678 |
| Decile 2 | 32.193 |
| Decile 1 | 22.6441 |
| Minimum | 0 |
|

|
- Mean = 52.0925
- Std.dev = 24.3947
- 518 items above graph maximum of 141.054
|
Instance 4 : On-line cycle 4, April 2012 to June 2012.
100,094 participants, 100,094 items
| Maximum | 449.481 |
| Decile 9 | 83.2193 |
| Decile 8 | 70.1155 |
| Decile 7 | 62.0454 |
| Decile 6 | 56.1821 |
| Median | 51.0255 |
| Decile 4 | 45.8844 |
| Decile 3 | 40.0649 |
| Decile 2 | 32.5915 |
| Decile 1 | 23.1595 |
| Minimum | 0 |
|
|
- Mean = 52.8701
- Std.dev = 24.9825
- 528 items above graph maximum of 143.279
|
