Data
457,927 items of data are available, covering 210,739 participants.
Defined-instances run from 0 to 4, labelled using Instancing
1.
Units of measurement are g.
| Maximum | 400.509 |
| Decile 9 | 71.3619 |
| Decile 8 | 57.8135 |
| Decile 7 | 49.3196 |
| Decile 6 | 42.7459 |
| Median | 37.1995 |
| Decile 4 | 32.1525 |
| Decile 3 | 27.2362 |
| Decile 2 | 22.0418 |
| Decile 1 | 15.8775 |
| Minimum | 0 |
|

|
- Mean = 41.1594
- Std.dev = 23.1339
- 2286 items above graph maximum of 126.846
|
5 Instances
Instance 0 : Conducted in assessment centre, April 2009 to September 2010.
70,630 participants, 70,630 items
| Maximum | 312.368 |
| Decile 9 | 70.3443 |
| Decile 8 | 56.4592 |
| Decile 7 | 47.8898 |
| Decile 6 | 41.207 |
| Median | 35.7001 |
| Decile 4 | 30.788 |
| Decile 3 | 25.8961 |
| Decile 2 | 20.7179 |
| Decile 1 | 14.6134 |
| Minimum | 0 |
|
|
- Mean = 39.9052
- Std.dev = 23.3859
- 376 items above graph maximum of 126.075
|
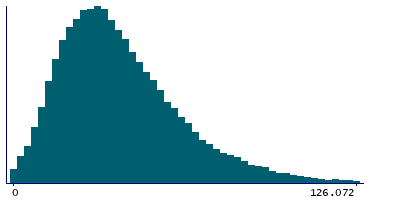
Instance 1 : On-line cycle 1, February 2011 to April 2011.
100,447 participants, 100,447 items
| Maximum | 297.248 |
| Decile 9 | 71.273 |
| Decile 8 | 57.846 |
| Decile 7 | 49.2649 |
| Decile 6 | 42.7859 |
| Median | 37.2076 |
| Decile 4 | 32.2069 |
| Decile 3 | 27.2671 |
| Decile 2 | 22.0892 |
| Decile 1 | 16.0438 |
| Minimum | 0 |
|

|
- Mean = 41.153
- Std.dev = 22.9903
- 474 items above graph maximum of 126.502
|
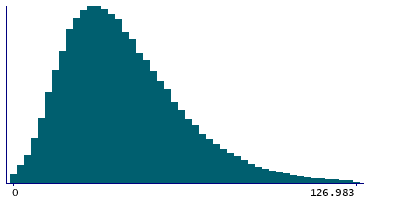
Instance 2 : On-line cycle 2, June 2011 to September 2011.
83,140 participants, 83,140 items
| Maximum | 400.509 |
| Decile 9 | 71.578 |
| Decile 8 | 58.1033 |
| Decile 7 | 49.724 |
| Decile 6 | 43.1435 |
| Median | 37.5711 |
| Decile 4 | 32.4681 |
| Decile 3 | 27.5206 |
| Decile 2 | 22.3623 |
| Decile 1 | 16.1697 |
| Minimum | 0 |
|
|
- Mean = 41.5071
- Std.dev = 23.194
- 432 items above graph maximum of 126.986
|
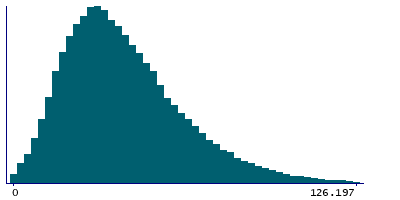
Instance 3 : On-line cycle 3, October 2011 to December 2011.
103,616 participants, 103,616 items
| Maximum | 285.268 |
| Decile 9 | 71.1 |
| Decile 8 | 57.729 |
| Decile 7 | 49.2809 |
| Decile 6 | 42.7567 |
| Median | 37.2009 |
| Decile 4 | 32.1242 |
| Decile 3 | 27.334 |
| Decile 2 | 22.1445 |
| Decile 1 | 15.9966 |
| Minimum | 0 |
|
|
- Mean = 41.1055
- Std.dev = 22.8943
- 497 items above graph maximum of 126.203
|
Instance 4 : On-line cycle 4, April 2012 to June 2012.
100,094 participants, 100,094 items
| Maximum | 304.824 |
| Decile 9 | 72.122 |
| Decile 8 | 58.5219 |
| Decile 7 | 50.0499 |
| Decile 6 | 43.4497 |
| Median | 37.9149 |
| Decile 4 | 32.8937 |
| Decile 3 | 27.8455 |
| Decile 2 | 22.5968 |
| Decile 1 | 16.3215 |
| Minimum | 0 |
|

|
- Mean = 41.818
- Std.dev = 23.2598
- 507 items above graph maximum of 127.923
|
