Data
457,927 items of data are available, covering 210,739 participants.
Defined-instances run from 0 to 4, labelled using Instancing
1.
Units of measurement are g.
| Maximum | 213.972 |
| Decile 9 | 45.1433 |
| Decile 8 | 37.2418 |
| Decile 7 | 32.2218 |
| Decile 6 | 28.3225 |
| Median | 24.9511 |
| Decile 4 | 21.8685 |
| Decile 3 | 18.8383 |
| Decile 2 | 15.6657 |
| Decile 1 | 11.8654 |
| Minimum | 0 |
|
|
- Mean = 27.1791
- Std.dev = 13.7899
- 2103 items above graph maximum of 78.4212
|
5 Instances
Instance 0 : Conducted in assessment centre, April 2009 to September 2010.
70,630 participants, 70,630 items
| Maximum | 194.834 |
| Decile 9 | 44.9027 |
| Decile 8 | 36.747 |
| Decile 7 | 31.5693 |
| Decile 6 | 27.5767 |
| Median | 24.2092 |
| Decile 4 | 21.1177 |
| Decile 3 | 18.049 |
| Decile 2 | 14.8829 |
| Decile 1 | 11.0452 |
| Minimum | 0 |
|
|
- Mean = 26.6003
- Std.dev = 14.1839
- 380 items above graph maximum of 78.7603
|
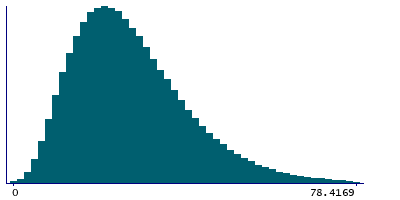
Instance 1 : On-line cycle 1, February 2011 to April 2011.
100,447 participants, 100,447 items
| Maximum | 177.851 |
| Decile 9 | 44.8466 |
| Decile 8 | 37.098 |
| Decile 7 | 32.0956 |
| Decile 6 | 28.2352 |
| Median | 24.9061 |
| Decile 4 | 21.8534 |
| Decile 3 | 18.9072 |
| Decile 2 | 15.7271 |
| Decile 1 | 12.0026 |
| Minimum | 0 |
|
|
- Mean = 27.0907
- Std.dev = 13.5708
- 454 items above graph maximum of 77.6907
|
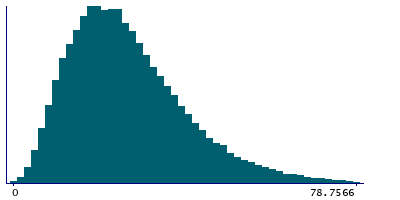
Instance 2 : On-line cycle 2, June 2011 to September 2011.
83,140 participants, 83,140 items
| Maximum | 207.875 |
| Decile 9 | 45.3187 |
| Decile 8 | 37.4869 |
| Decile 7 | 32.4437 |
| Decile 6 | 28.5233 |
| Median | 25.165 |
| Decile 4 | 22.026 |
| Decile 3 | 18.9477 |
| Decile 2 | 15.7414 |
| Decile 1 | 11.9444 |
| Minimum | 0 |
|

|
- Mean = 27.3395
- Std.dev = 13.8261
- 373 items above graph maximum of 78.6929
|
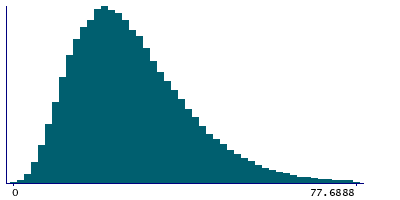
Instance 3 : On-line cycle 3, October 2011 to December 2011.
103,616 participants, 103,616 items
| Maximum | 171.151 |
| Decile 9 | 44.7943 |
| Decile 8 | 36.9895 |
| Decile 7 | 32.0299 |
| Decile 6 | 28.1901 |
| Median | 24.872 |
| Decile 4 | 21.8138 |
| Decile 3 | 18.8583 |
| Decile 2 | 15.7903 |
| Decile 1 | 12.0334 |
| Minimum | 0 |
|

|
- Mean = 27.0688
- Std.dev = 13.5287
- 468 items above graph maximum of 77.5552
|
Instance 4 : On-line cycle 4, April 2012 to June 2012.
100,094 participants, 100,094 items
| Maximum | 213.972 |
| Decile 9 | 45.7665 |
| Decile 8 | 37.8009 |
| Decile 7 | 32.7973 |
| Decile 6 | 28.8646 |
| Median | 25.4615 |
| Decile 4 | 22.3266 |
| Decile 3 | 19.2431 |
| Decile 2 | 16.0076 |
| Decile 1 | 12.1331 |
| Minimum | 0 |
|

|
- Mean = 27.657
- Std.dev = 13.9447
- 438 items above graph maximum of 79.3999
|
