Data
457,927 items of data are available, covering 210,739 participants.
Defined-instances run from 0 to 4, labelled using Instancing
1.
Units of measurement are g.
| Maximum | 123.16 |
| Decile 9 | 18.6696 |
| Decile 8 | 15.0334 |
| Decile 7 | 12.8541 |
| Decile 6 | 11.2138 |
| Median | 9.83755 |
| Decile 4 | 8.58786 |
| Decile 3 | 7.377 |
| Decile 2 | 6.12205 |
| Decile 1 | 4.64328 |
| Minimum | 0 |
|

|
- Mean = 10.9933
- Std.dev = 6.05005
- 3436 items above graph maximum of 32.696
|
5 Instances
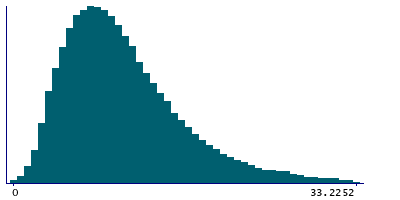
Instance 0 : Conducted in assessment centre, April 2009 to September 2010.
70,630 participants, 70,630 items
| Maximum | 114.053 |
| Decile 9 | 18.8057 |
| Decile 8 | 14.9903 |
| Decile 7 | 12.7351 |
| Decile 6 | 11.0334 |
| Median | 9.63464 |
| Decile 4 | 8.36309 |
| Decile 3 | 7.14025 |
| Decile 2 | 5.8705 |
| Decile 1 | 4.38443 |
| Minimum | 0 |
|
|
- Mean = 10.8728
- Std.dev = 6.25653
- 553 items above graph maximum of 33.2269
|
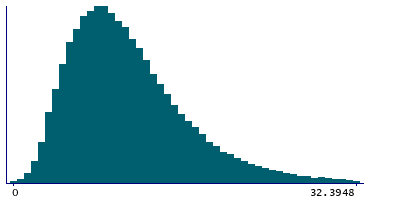
Instance 1 : On-line cycle 1, February 2011 to April 2011.
100,447 participants, 100,447 items
| Maximum | 94.7917 |
| Decile 9 | 18.5656 |
| Decile 8 | 15.0252 |
| Decile 7 | 12.8675 |
| Decile 6 | 11.2533 |
| Median | 9.88909 |
| Decile 4 | 8.64956 |
| Decile 3 | 7.45888 |
| Decile 2 | 6.20211 |
| Decile 1 | 4.73558 |
| Minimum | 0 |
|
|
- Mean = 11.0109
- Std.dev = 5.95842
- 752 items above graph maximum of 32.3956
|
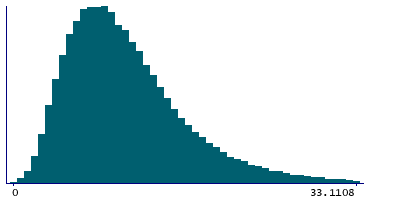
Instance 2 : On-line cycle 2, June 2011 to September 2011.
83,140 participants, 83,140 items
| Maximum | 123.16 |
| Decile 9 | 18.8865 |
| Decile 8 | 15.1247 |
| Decile 7 | 12.9262 |
| Decile 6 | 11.2609 |
| Median | 9.87275 |
| Decile 4 | 8.60976 |
| Decile 3 | 7.37939 |
| Decile 2 | 6.13266 |
| Decile 1 | 4.65313 |
| Minimum | 0 |
|
|
- Mean = 11.0522
- Std.dev = 6.1057
- 607 items above graph maximum of 33.1198
|
Instance 3 : On-line cycle 3, October 2011 to December 2011.
103,616 participants, 103,616 items
| Maximum | 73.8333 |
| Decile 9 | 18.2448 |
| Decile 8 | 14.7494 |
| Decile 7 | 12.6235 |
| Decile 6 | 11.0418 |
| Median | 9.71321 |
| Decile 4 | 8.49165 |
| Decile 3 | 7.31567 |
| Decile 2 | 6.09787 |
| Decile 1 | 4.65376 |
| Minimum | 0 |
|

|
- Mean = 10.8187
- Std.dev = 5.85067
- 756 items above graph maximum of 31.8358
|
Instance 4 : On-line cycle 4, April 2012 to June 2012.
100,094 participants, 100,094 items
| Maximum | 110.805 |
| Decile 9 | 18.9752 |
| Decile 8 | 15.3036 |
| Decile 7 | 13.0906 |
| Decile 6 | 11.4317 |
| Median | 10.0411 |
| Decile 4 | 8.76309 |
| Decile 3 | 7.52765 |
| Decile 2 | 6.23926 |
| Decile 1 | 4.72135 |
| Minimum | 0 |
|

|
- Mean = 11.1926
- Std.dev = 6.14197
- 743 items above graph maximum of 33.2291
|
