Data
457,927 items of data are available, covering 210,739 participants.
Defined-instances run from 0 to 4, labelled using Instancing
1.
Units of measurement are g.
| Maximum | 216.159 |
| Decile 9 | 27.1786 |
| Decile 8 | 23.3129 |
| Decile 7 | 20.8355 |
| Decile 6 | 18.8661 |
| Median | 17.1342 |
| Decile 4 | 15.4714 |
| Decile 3 | 13.7808 |
| Decile 2 | 11.8797 |
| Decile 1 | 9.37888 |
| Minimum | 0 |
|

|
- Mean = 17.9112
- Std.dev = 7.435
- 2020 items above graph maximum of 44.9784
|
5 Instances
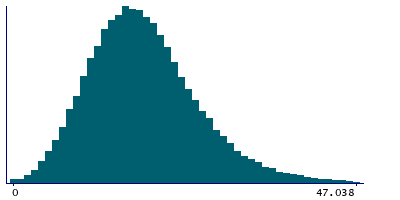
Instance 0 : Conducted in assessment centre, April 2009 to September 2010.
70,630 participants, 70,630 items
| Maximum | 179.619 |
| Decile 9 | 27.9814 |
| Decile 8 | 23.7648 |
| Decile 7 | 21.095 |
| Decile 6 | 19.0149 |
| Median | 17.1781 |
| Decile 4 | 15.4071 |
| Decile 3 | 13.5769 |
| Decile 2 | 11.5581 |
| Decile 1 | 8.9265 |
| Minimum | 0 |
|
|
- Mean = 18.0425
- Std.dev = 7.98984
- 352 items above graph maximum of 47.0363
|
Instance 1 : On-line cycle 1, February 2011 to April 2011.
100,447 participants, 100,447 items
| Maximum | 143.4 |
| Decile 9 | 27.2744 |
| Decile 8 | 23.4448 |
| Decile 7 | 20.9775 |
| Decile 6 | 19.003 |
| Median | 17.2567 |
| Decile 4 | 15.612 |
| Decile 3 | 13.9588 |
| Decile 2 | 12.0647 |
| Decile 1 | 9.5869 |
| Minimum | 0 |
|

|
- Mean = 18.0505
- Std.dev = 7.38129
- 432 items above graph maximum of 44.9618
|
Instance 2 : On-line cycle 2, June 2011 to September 2011.
83,140 participants, 83,140 items
| Maximum | 138.235 |
| Decile 9 | 27.0555 |
| Decile 8 | 23.1931 |
| Decile 7 | 20.719 |
| Decile 6 | 18.7772 |
| Median | 17.0447 |
| Decile 4 | 15.3728 |
| Decile 3 | 13.7075 |
| Decile 2 | 11.8477 |
| Decile 1 | 9.33105 |
| Minimum | 0 |
|

|
- Mean = 17.8232
- Std.dev = 7.39072
- 355 items above graph maximum of 44.7799
|
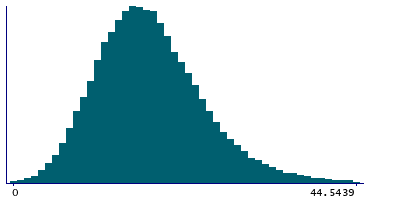
Instance 3 : On-line cycle 3, October 2011 to December 2011.
103,616 participants, 103,616 items
| Maximum | 140.726 |
| Decile 9 | 26.9947 |
| Decile 8 | 23.2428 |
| Decile 7 | 20.7718 |
| Decile 6 | 18.8264 |
| Median | 17.1448 |
| Decile 4 | 15.4947 |
| Decile 3 | 13.8095 |
| Decile 2 | 11.9271 |
| Decile 1 | 9.45189 |
| Minimum | 0 |
|
|
- Mean = 17.8789
- Std.dev = 7.27318
- 428 items above graph maximum of 44.5375
|
Instance 4 : On-line cycle 4, April 2012 to June 2012.
100,094 participants, 100,094 items
| Maximum | 216.159 |
| Decile 9 | 26.8055 |
| Decile 8 | 23.0313 |
| Decile 7 | 20.6485 |
| Decile 6 | 18.7413 |
| Median | 17.038 |
| Decile 4 | 15.4246 |
| Decile 3 | 13.7661 |
| Decile 2 | 11.8812 |
| Decile 1 | 9.44412 |
| Minimum | 0 |
|

|
- Mean = 17.7855
- Std.dev = 7.27964
- 439 items above graph maximum of 44.1669
|
