Data
457,927 items of data are available, covering 210,739 participants.
Defined-instances run from 0 to 4, labelled using Instancing
1.
Units of measurement are mg.
| Maximum | 19.1981 |
| Decile 9 | 3.03961 |
| Decile 8 | 2.62255 |
| Decile 7 | 2.36219 |
| Decile 6 | 2.15718 |
| Median | 1.97627 |
| Decile 4 | 1.80354 |
| Decile 3 | 1.62532 |
| Decile 2 | 1.4265 |
| Decile 1 | 1.16229 |
| Minimum | 0 |
|
|
- Mean = 2.05776
- Std.dev = 0.777633
- 1808 items above graph maximum of 4.91692
|
5 Instances
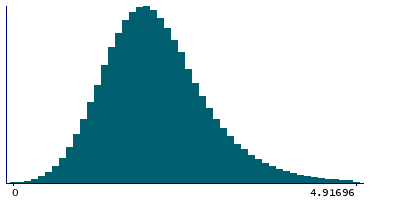
Instance 0 : Conducted in assessment centre, April 2009 to September 2010.
70,630 participants, 70,630 items
| Maximum | 19.1981 |
| Decile 9 | 3.11408 |
| Decile 8 | 2.67314 |
| Decile 7 | 2.3942 |
| Decile 6 | 2.182 |
| Median | 1.99084 |
| Decile 4 | 1.81337 |
| Decile 3 | 1.62451 |
| Decile 2 | 1.41557 |
| Decile 1 | 1.1355 |
| Minimum | 0 |
|
|
- Mean = 2.08024
- Std.dev = 0.824546
- 299 items above graph maximum of 5.09266
|
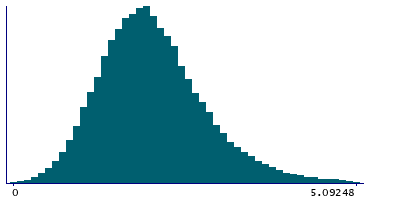
Instance 1 : On-line cycle 1, February 2011 to April 2011.
100,447 participants, 100,447 items
| Maximum | 12.2394 |
| Decile 9 | 3.03402 |
| Decile 8 | 2.62763 |
| Decile 7 | 2.36883 |
| Decile 6 | 2.165 |
| Median | 1.98646 |
| Decile 4 | 1.81501 |
| Decile 3 | 1.63862 |
| Decile 2 | 1.4403 |
| Decile 1 | 1.17801 |
| Minimum | 0 |
|
|
- Mean = 2.06472
- Std.dev = 0.76555
- 366 items above graph maximum of 4.89003
|
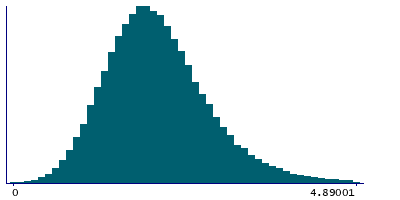
Instance 2 : On-line cycle 2, June 2011 to September 2011.
83,140 participants, 83,140 items
| Maximum | 17.3867 |
| Decile 9 | 3.04385 |
| Decile 8 | 2.62233 |
| Decile 7 | 2.36126 |
| Decile 6 | 2.155 |
| Median | 1.97208 |
| Decile 4 | 1.79791 |
| Decile 3 | 1.6164 |
| Decile 2 | 1.4195 |
| Decile 1 | 1.15555 |
| Minimum | 0 |
|

|
- Mean = 2.05431
- Std.dev = 0.781402
- 336 items above graph maximum of 4.93215
|
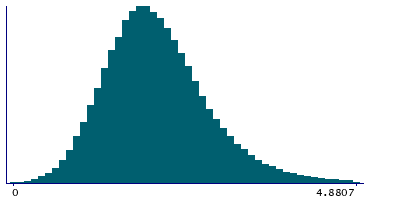
Instance 3 : On-line cycle 3, October 2011 to December 2011.
103,616 participants, 103,616 items
| Maximum | 13.2895 |
| Decile 9 | 3.00464 |
| Decile 8 | 2.6 |
| Decile 7 | 2.34306 |
| Decile 6 | 2.14287 |
| Median | 1.96488 |
| Decile 4 | 1.79382 |
| Decile 3 | 1.61858 |
| Decile 2 | 1.42207 |
| Decile 1 | 1.16513 |
| Minimum | 0 |
|

|
- Mean = 2.04286
- Std.dev = 0.76024
- 380 items above graph maximum of 4.84415
|
Instance 4 : On-line cycle 4, April 2012 to June 2012.
100,094 participants, 100,094 items
| Maximum | 13.0359 |
| Decile 9 | 3.02463 |
| Decile 8 | 2.61 |
| Decile 7 | 2.35384 |
| Decile 6 | 2.15101 |
| Median | 1.9701 |
| Decile 4 | 1.79964 |
| Decile 3 | 1.62672 |
| Decile 2 | 1.4301 |
| Decile 1 | 1.16899 |
| Minimum | 0 |
|
|
- Mean = 2.0532
- Std.dev = 0.769762
- 409 items above graph maximum of 4.88027
|
