Data
457,927 items of data are available, covering 210,739 participants.
Defined-instances run from 0 to 4, labelled using Instancing
1.
Units of measurement are mg.
| Maximum | 30445.5 |
| Decile 9 | 5164.51 |
| Decile 8 | 4557.39 |
| Decile 7 | 4170.35 |
| Decile 6 | 3854.97 |
| Median | 3571.99 |
| Decile 4 | 3299.37 |
| Decile 3 | 3015.27 |
| Decile 2 | 2695.12 |
| Decile 1 | 2265.16 |
| Minimum | 0 |
|

|
- Mean = 3671.86
- Std.dev = 1203.18
- 1769 items above graph maximum of 8063.86
|
5 Instances
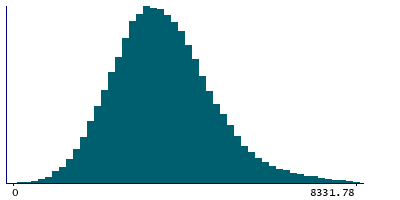
Instance 0 : Conducted in assessment centre, April 2009 to September 2010.
70,630 participants, 70,630 items
| Maximum | 30445.5 |
| Decile 9 | 5247.52 |
| Decile 8 | 4608.62 |
| Decile 7 | 4195.87 |
| Decile 6 | 3863.9 |
| Median | 3558.21 |
| Decile 4 | 3262.83 |
| Decile 3 | 2963.98 |
| Decile 2 | 2624.24 |
| Decile 1 | 2163.3 |
| Minimum | 0 |
|
|
- Mean = 3668.45
- Std.dev = 1295.48
- 301 items above graph maximum of 8331.74
|
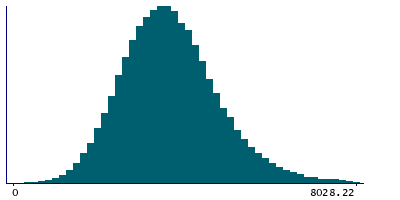
Instance 1 : On-line cycle 1, February 2011 to April 2011.
100,447 participants, 100,447 items
| Maximum | 21086.5 |
| Decile 9 | 5165.79 |
| Decile 8 | 4570.85 |
| Decile 7 | 4190.31 |
| Decile 6 | 3880.04 |
| Median | 3602.02 |
| Decile 4 | 3328.98 |
| Decile 3 | 3043.83 |
| Decile 2 | 2726.11 |
| Decile 1 | 2303.16 |
| Minimum | 0 |
|
|
- Mean = 3693.88
- Std.dev = 1185.06
- 391 items above graph maximum of 8028.43
|
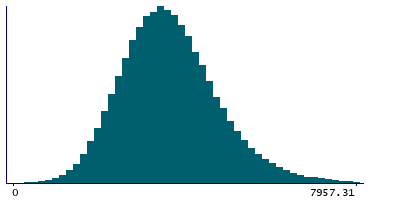
Instance 2 : On-line cycle 2, June 2011 to September 2011.
83,140 participants, 83,140 items
| Maximum | 28735.9 |
| Decile 9 | 5178.74 |
| Decile 8 | 4574.76 |
| Decile 7 | 4181.97 |
| Decile 6 | 3864.13 |
| Median | 3578.39 |
| Decile 4 | 3308.46 |
| Decile 3 | 3026.76 |
| Decile 2 | 2709.26 |
| Decile 1 | 2278.09 |
| Minimum | 0 |
|

|
- Mean = 3682.19
- Std.dev = 1202.19
- 333 items above graph maximum of 8079.39
|
Instance 3 : On-line cycle 3, October 2011 to December 2011.
103,616 participants, 103,616 items
| Maximum | 21891.9 |
| Decile 9 | 5114.71 |
| Decile 8 | 4520.04 |
| Decile 7 | 4135.19 |
| Decile 6 | 3828.22 |
| Median | 3549.1 |
| Decile 4 | 3282.85 |
| Decile 3 | 3004.57 |
| Decile 2 | 2692.53 |
| Decile 1 | 2272.52 |
| Minimum | 0 |
|
|
- Mean = 3647.89
- Std.dev = 1170.11
- 379 items above graph maximum of 7956.9
|
Instance 4 : On-line cycle 4, April 2012 to June 2012.
100,094 participants, 100,094 items
| Maximum | 25094.1 |
| Decile 9 | 5137.21 |
| Decile 8 | 4536.09 |
| Decile 7 | 4159.83 |
| Decile 6 | 3845.65 |
| Median | 3570.85 |
| Decile 4 | 3303.18 |
| Decile 3 | 3021.74 |
| Decile 2 | 2702.07 |
| Decile 1 | 2280.5 |
| Minimum | 0 |
|

|
- Mean = 3668.39
- Std.dev = 1187.6
- 394 items above graph maximum of 7993.92
|
