Data
457,927 items of data are available, covering 210,739 participants.
Defined-instances run from 0 to 4, labelled using Instancing
1.
Units of measurement are mg.
| Maximum | 3026.25 |
| Decile 9 | 466.22 |
| Decile 8 | 410.898 |
| Decile 7 | 375.596 |
| Decile 6 | 347.751 |
| Median | 323.324 |
| Decile 4 | 299.785 |
| Decile 3 | 275.533 |
| Decile 2 | 248.204 |
| Decile 1 | 211.59 |
| Minimum | 0 |
|
|
- Mean = 333.692
- Std.dev = 106.615
- 2020 items above graph maximum of 720.851
|
5 Instances
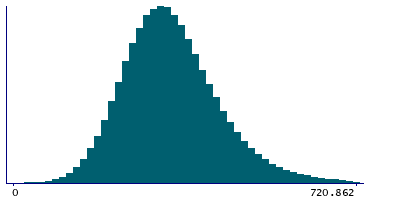
Instance 0 : Conducted in assessment centre, April 2009 to September 2010.
70,630 participants, 70,630 items
| Maximum | 3026.25 |
| Decile 9 | 473.325 |
| Decile 8 | 414.869 |
| Decile 7 | 377.674 |
| Decile 6 | 348.17 |
| Median | 322.375 |
| Decile 4 | 297.189 |
| Decile 3 | 271.42 |
| Decile 2 | 242.597 |
| Decile 1 | 203.772 |
| Minimum | 0 |
|
|
- Mean = 333.42
- Std.dev = 114.4
- 345 items above graph maximum of 742.879
|
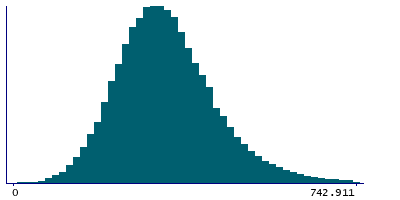
Instance 1 : On-line cycle 1, February 2011 to April 2011.
100,447 participants, 100,447 items
| Maximum | 1792.33 |
| Decile 9 | 465.965 |
| Decile 8 | 411.413 |
| Decile 7 | 377.033 |
| Decile 6 | 349.552 |
| Median | 325.305 |
| Decile 4 | 302.091 |
| Decile 3 | 277.971 |
| Decile 2 | 250.459 |
| Decile 1 | 214.243 |
| Minimum | 0 |
|

|
- Mean = 335.168
- Std.dev = 104.726
- 402 items above graph maximum of 717.687
|
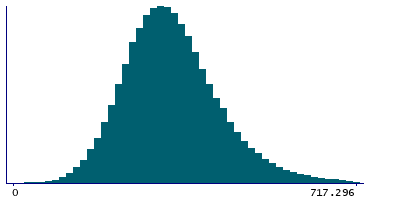
Instance 2 : On-line cycle 2, June 2011 to September 2011.
83,140 participants, 83,140 items
| Maximum | 2588.76 |
| Decile 9 | 464.966 |
| Decile 8 | 409.831 |
| Decile 7 | 374.828 |
| Decile 6 | 347.166 |
| Median | 323.086 |
| Decile 4 | 299.481 |
| Decile 3 | 275.562 |
| Decile 2 | 248.658 |
| Decile 1 | 212.631 |
| Minimum | 0 |
|
|
- Mean = 333.338
- Std.dev = 105.871
- 371 items above graph maximum of 717.301
|
Instance 3 : On-line cycle 3, October 2011 to December 2011.
103,616 participants, 103,616 items
| Maximum | 1954.86 |
| Decile 9 | 462.503 |
| Decile 8 | 408.085 |
| Decile 7 | 372.895 |
| Decile 6 | 345.446 |
| Median | 321.255 |
| Decile 4 | 298.091 |
| Decile 3 | 274.129 |
| Decile 2 | 247.46 |
| Decile 1 | 211.396 |
| Minimum | 0 |
|

|
- Mean = 331.598
- Std.dev = 104.014
- 395 items above graph maximum of 713.61
|
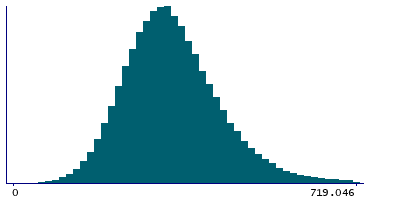
Instance 4 : On-line cycle 4, April 2012 to June 2012.
100,094 participants, 100,094 items
| Maximum | 2428.99 |
| Decile 9 | 466.411 |
| Decile 8 | 411.375 |
| Decile 7 | 376.179 |
| Decile 6 | 348.416 |
| Median | 324.252 |
| Decile 4 | 301.215 |
| Decile 3 | 277.283 |
| Decile 2 | 250.058 |
| Decile 1 | 213.791 |
| Minimum | 0 |
|
|
- Mean = 334.867
- Std.dev = 106.034
- 473 items above graph maximum of 719.03
|
