Data
457,927 items of data are available, covering 210,739 participants.
Defined-instances run from 0 to 4, labelled using Instancing
1.
Units of measurement are ug.
| Maximum | 39093.9 |
| Decile 9 | 642.74 |
| Decile 8 | 492.628 |
| Decile 7 | 407.72 |
| Decile 6 | 345.419 |
| Median | 293.535 |
| Decile 4 | 246.712 |
| Decile 3 | 201.33 |
| Decile 2 | 154.76 |
| Decile 1 | 100.006 |
| Minimum | 0 |
|

|
- Mean = 475.856
- Std.dev = 1138.46
- 11273 items above graph maximum of 1185.47
|
5 Instances
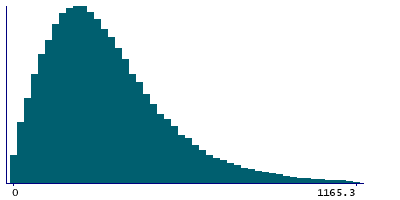
Instance 0 : Conducted in assessment centre, April 2009 to September 2010.
70,630 participants, 70,630 items
| Maximum | 38736.5 |
| Decile 9 | 629.259 |
| Decile 8 | 482.903 |
| Decile 7 | 398.76 |
| Decile 6 | 337.508 |
| Median | 285.72 |
| Decile 4 | 239.08 |
| Decile 3 | 194.187 |
| Decile 2 | 147.93 |
| Decile 1 | 93.1086 |
| Minimum | 0 |
|
|
- Mean = 442.798
- Std.dev = 1058.42
- 1500 items above graph maximum of 1165.41
|
Instance 1 : On-line cycle 1, February 2011 to April 2011.
100,447 participants, 100,447 items
| Maximum | 39093.9 |
| Decile 9 | 640.814 |
| Decile 8 | 492.978 |
| Decile 7 | 408.423 |
| Decile 6 | 345.829 |
| Median | 294.353 |
| Decile 4 | 247.34 |
| Decile 3 | 201.986 |
| Decile 2 | 154.913 |
| Decile 1 | 100.356 |
| Minimum | 0 |
|

|
- Mean = 483.318
- Std.dev = 1157.86
- 2628 items above graph maximum of 1181.27
|
Instance 2 : On-line cycle 2, June 2011 to September 2011.
83,140 participants, 83,140 items
| Maximum | 38939.2 |
| Decile 9 | 640.062 |
| Decile 8 | 490.504 |
| Decile 7 | 406.436 |
| Decile 6 | 344.305 |
| Median | 292.598 |
| Decile 4 | 246.249 |
| Decile 3 | 200.907 |
| Decile 2 | 154.936 |
| Decile 1 | 100.379 |
| Minimum | 0 |
|

|
- Mean = 474.383
- Std.dev = 1150.71
- 2028 items above graph maximum of 1179.75
|
Instance 3 : On-line cycle 3, October 2011 to December 2011.
103,616 participants, 103,616 items
| Maximum | 38496.2 |
| Decile 9 | 647.083 |
| Decile 8 | 494.172 |
| Decile 7 | 408.188 |
| Decile 6 | 345.528 |
| Median | 293.32 |
| Decile 4 | 247.508 |
| Decile 3 | 202.23 |
| Decile 2 | 156.21 |
| Decile 1 | 101.855 |
| Minimum | 0 |
|

|
- Mean = 487.776
- Std.dev = 1172.8
- 2630 items above graph maximum of 1192.31
|
Instance 4 : On-line cycle 4, April 2012 to June 2012.
100,094 participants, 100,094 items
| Maximum | 38956.1 |
| Decile 9 | 651.269 |
| Decile 8 | 498.978 |
| Decile 7 | 413.552 |
| Decile 6 | 351.699 |
| Median | 299.31 |
| Decile 4 | 251.389 |
| Decile 3 | 205.207 |
| Decile 2 | 158.024 |
| Decile 1 | 102.591 |
| Minimum | 0 |
|

|
- Mean = 480.579
- Std.dev = 1126.49
- 2480 items above graph maximum of 1199.95
|
