Data
457,927 items of data are available, covering 210,739 participants.
Defined-instances run from 0 to 4, labelled using Instancing
1.
Units of measurement are mg.
| Maximum | 116.042 |
| Decile 9 | 17.9306 |
| Decile 8 | 14.8864 |
| Decile 7 | 12.9553 |
| Decile 6 | 11.4481 |
| Median | 10.1631 |
| Decile 4 | 8.99258 |
| Decile 3 | 7.83648 |
| Decile 2 | 6.60134 |
| Decile 1 | 5.1177 |
| Minimum | 0 |
|

|
- Mean = 11.0087
- Std.dev = 5.31577
- 2071 items above graph maximum of 30.7435
|
5 Instances
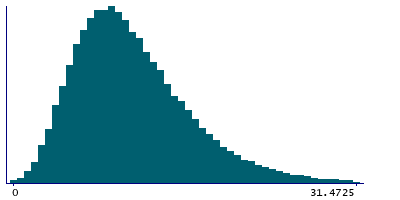
Instance 0 : Conducted in assessment centre, April 2009 to September 2010.
70,630 participants, 70,630 items
| Maximum | 114.941 |
| Decile 9 | 18.1974 |
| Decile 8 | 15.0505 |
| Decile 7 | 13.0058 |
| Decile 6 | 11.4315 |
| Median | 10.0932 |
| Decile 4 | 8.90145 |
| Decile 3 | 7.70231 |
| Decile 2 | 6.4499 |
| Decile 1 | 4.92235 |
| Minimum | 0 |
|
|
- Mean = 11.0127
- Std.dev = 5.54322
- 324 items above graph maximum of 31.4724
|
Instance 1 : On-line cycle 1, February 2011 to April 2011.
100,447 participants, 100,447 items
| Maximum | 80.2727 |
| Decile 9 | 17.8824 |
| Decile 8 | 14.8868 |
| Decile 7 | 12.9876 |
| Decile 6 | 11.4733 |
| Median | 10.2181 |
| Decile 4 | 9.06387 |
| Decile 3 | 7.90819 |
| Decile 2 | 6.67112 |
| Decile 1 | 5.20866 |
| Minimum | 0 |
|

|
- Mean = 11.042
- Std.dev = 5.25725
- 448 items above graph maximum of 30.5562
|
Instance 2 : On-line cycle 2, June 2011 to September 2011.
83,140 participants, 83,140 items
| Maximum | 116.042 |
| Decile 9 | 18.2162 |
| Decile 8 | 15.1278 |
| Decile 7 | 13.1916 |
| Decile 6 | 11.6408 |
| Median | 10.3259 |
| Decile 4 | 9.12276 |
| Decile 3 | 7.95009 |
| Decile 2 | 6.70098 |
| Decile 1 | 5.2118 |
| Minimum | 0 |
|

|
- Mean = 11.1824
- Std.dev = 5.37619
- 357 items above graph maximum of 31.2205
|
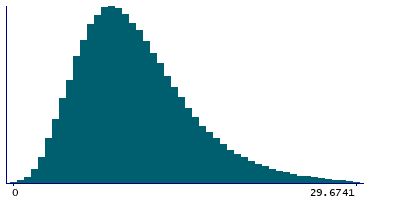
Instance 3 : On-line cycle 3, October 2011 to December 2011.
103,616 participants, 103,616 items
| Maximum | 68.3375 |
| Decile 9 | 17.3486 |
| Decile 8 | 14.3688 |
| Decile 7 | 12.5252 |
| Decile 6 | 11.0935 |
| Median | 9.86303 |
| Decile 4 | 8.73894 |
| Decile 3 | 7.64394 |
| Decile 2 | 6.46403 |
| Decile 1 | 5.02473 |
| Minimum | 0 |
|
|
- Mean = 10.6775
- Std.dev = 5.09833
- 461 items above graph maximum of 29.6724
|
Instance 4 : On-line cycle 4, April 2012 to June 2012.
100,094 participants, 100,094 items
| Maximum | 98.7836 |
| Decile 9 | 18.1337 |
| Decile 8 | 15.1098 |
| Decile 7 | 13.1598 |
| Decile 6 | 11.6337 |
| Median | 10.3414 |
| Decile 4 | 9.14737 |
| Decile 3 | 7.969 |
| Decile 2 | 6.71743 |
| Decile 1 | 5.19794 |
| Minimum | 0 |
|

|
- Mean = 11.1708
- Std.dev = 5.36442
- 466 items above graph maximum of 31.0694
|
