Data
457,927 items of data are available, covering 210,739 participants.
Defined-instances run from 0 to 4, labelled using Instancing
1.
Units of measurement are ug.
| Maximum | 52.6223 |
| Decile 9 | 9.056 |
| Decile 8 | 5.19285 |
| Decile 7 | 3.88578 |
| Decile 6 | 3.1003 |
| Median | 2.51202 |
| Decile 4 | 2.02774 |
| Decile 3 | 1.59652 |
| Decile 2 | 1.18235 |
| Decile 1 | 0.703016 |
| Minimum | 0 |
|

|
- Mean = 3.64296
- Std.dev = 3.54532
- 4640 items above graph maximum of 17.409
|
5 Instances
Instance 0 : Conducted in assessment centre, April 2009 to September 2010.
70,630 participants, 70,630 items
| Maximum | 51.9869 |
| Decile 9 | 8.8942 |
| Decile 8 | 5.0233 |
| Decile 7 | 3.77652 |
| Decile 6 | 3.01821 |
| Median | 2.4526 |
| Decile 4 | 1.97222 |
| Decile 3 | 1.55054 |
| Decile 2 | 1.1378 |
| Decile 1 | 0.6418 |
| Minimum | 0 |
|

|
- Mean = 3.54761
- Std.dev = 3.51595
- 737 items above graph maximum of 17.1466
|
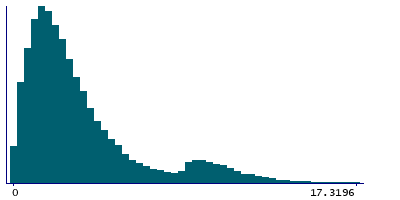
Instance 1 : On-line cycle 1, February 2011 to April 2011.
100,447 participants, 100,447 items
| Maximum | 52.0718 |
| Decile 9 | 9.019 |
| Decile 8 | 5.16504 |
| Decile 7 | 3.85595 |
| Decile 6 | 3.08268 |
| Median | 2.50442 |
| Decile 4 | 2.02439 |
| Decile 3 | 1.5968 |
| Decile 2 | 1.18878 |
| Decile 1 | 0.718415 |
| Minimum | 0 |
|
|
- Mean = 3.62133
- Std.dev = 3.50703
- 1004 items above graph maximum of 17.3196
|
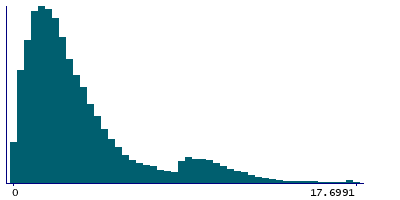
Instance 2 : On-line cycle 2, June 2011 to September 2011.
83,140 participants, 83,140 items
| Maximum | 47.6723 |
| Decile 9 | 9.20322 |
| Decile 8 | 5.33651 |
| Decile 7 | 3.97292 |
| Decile 6 | 3.17312 |
| Median | 2.55581 |
| Decile 4 | 2.06654 |
| Decile 3 | 1.62138 |
| Decile 2 | 1.1872 |
| Decile 1 | 0.708709 |
| Minimum | 0 |
|
|
- Mean = 3.7306
- Std.dev = 3.65527
- 891 items above graph maximum of 17.6977
|
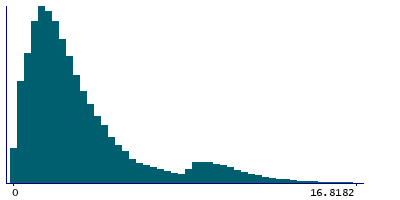
Instance 3 : On-line cycle 3, October 2011 to December 2011.
103,616 participants, 103,616 items
| Maximum | 52.6223 |
| Decile 9 | 8.76262 |
| Decile 8 | 4.98033 |
| Decile 7 | 3.78239 |
| Decile 6 | 3.02208 |
| Median | 2.46158 |
| Decile 4 | 1.99449 |
| Decile 3 | 1.57882 |
| Decile 2 | 1.17805 |
| Decile 1 | 0.706553 |
| Minimum | 0 |
|
|
- Mean = 3.5235
- Std.dev = 3.38617
- 990 items above graph maximum of 16.8187
|
Instance 4 : On-line cycle 4, April 2012 to June 2012.
100,094 participants, 100,094 items
| Maximum | 51.8835 |
| Decile 9 | 9.36656 |
| Decile 8 | 5.49371 |
| Decile 7 | 4.04499 |
| Decile 6 | 3.20316 |
| Median | 2.58455 |
| Decile 4 | 2.07414 |
| Decile 3 | 1.63586 |
| Decile 2 | 1.20545 |
| Decile 1 | 0.719184 |
| Minimum | 0 |
|

|
- Mean = 3.78281
- Std.dev = 3.66379
- 901 items above graph maximum of 18.0139
|
