Data
457,927 items of data are available, covering 210,739 participants.
Defined-instances run from 0 to 4, labelled using Instancing
1.
Units of measurement are g.
| Maximum | 1450.85 |
| Decile 9 | 198.618 |
| Decile 8 | 168.972 |
| Decile 7 | 150.572 |
| Decile 6 | 135.892 |
| Median | 123.179 |
| Decile 4 | 110.866 |
| Decile 3 | 98.1185 |
| Decile 2 | 83.7566 |
| Decile 1 | 64.1702 |
| Minimum | 0 |
|

|
- Mean = 128.761
- Std.dev = 56.1045
- 2030 items above graph maximum of 333.065
|
5 Instances
Instance 0 : Conducted in assessment centre, April 2009 to September 2010.
70,630 participants, 70,630 items
| Maximum | 1450.85 |
| Decile 9 | 203.713 |
| Decile 8 | 171.564 |
| Decile 7 | 152.037 |
| Decile 6 | 136.45 |
| Median | 123.226 |
| Decile 4 | 110.44 |
| Decile 3 | 96.9778 |
| Decile 2 | 82.2199 |
| Decile 1 | 62.4235 |
| Minimum | 0 |
|
|
- Mean = 129.784
- Std.dev = 59.5435
- 352 items above graph maximum of 345.003
|
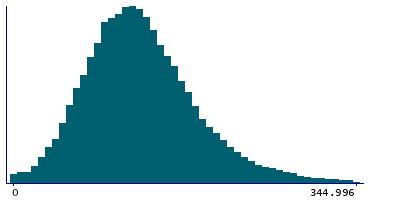
Instance 1 : On-line cycle 1, February 2011 to April 2011.
100,447 participants, 100,447 items
| Maximum | 731.092 |
| Decile 9 | 198.843 |
| Decile 8 | 169.874 |
| Decile 7 | 151.562 |
| Decile 6 | 136.776 |
| Median | 124.218 |
| Decile 4 | 111.943 |
| Decile 3 | 99.2346 |
| Decile 2 | 85.1076 |
| Decile 1 | 65.8264 |
| Minimum | 0 |
|
|
- Mean = 129.665
- Std.dev = 55.3167
- 406 items above graph maximum of 331.859
|
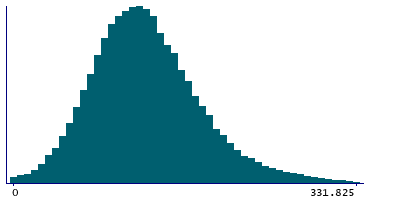
Instance 2 : On-line cycle 2, June 2011 to September 2011.
83,140 participants, 83,140 items
| Maximum | 889.281 |
| Decile 9 | 196.575 |
| Decile 8 | 166.692 |
| Decile 7 | 148.614 |
| Decile 6 | 134.266 |
| Median | 121.652 |
| Decile 4 | 109.288 |
| Decile 3 | 96.4803 |
| Decile 2 | 82.0658 |
| Decile 1 | 62.5153 |
| Minimum | 0 |
|
|
- Mean = 126.83
- Std.dev = 55.5515
- 337 items above graph maximum of 330.634
|
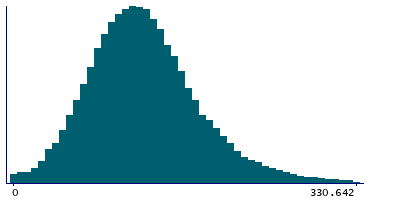
Instance 3 : On-line cycle 3, October 2011 to December 2011.
103,616 participants, 103,616 items
| Maximum | 667.597 |
| Decile 9 | 197.599 |
| Decile 8 | 168.672 |
| Decile 7 | 150.768 |
| Decile 6 | 136.354 |
| Median | 123.719 |
| Decile 4 | 111.533 |
| Decile 3 | 99.1105 |
| Decile 2 | 84.9039 |
| Decile 1 | 65.5604 |
| Minimum | 0 |
|

|
- Mean = 129.16
- Std.dev = 54.976
- 451 items above graph maximum of 329.638
|
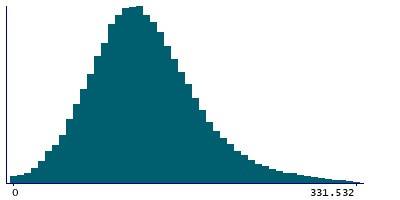
Instance 4 : On-line cycle 4, April 2012 to June 2012.
100,094 participants, 100,094 items
| Maximum | 1031.65 |
| Decile 9 | 197.661 |
| Decile 8 | 168.241 |
| Decile 7 | 149.998 |
| Decile 6 | 135.5 |
| Median | 122.748 |
| Decile 4 | 110.589 |
| Decile 3 | 98.04 |
| Decile 2 | 83.6244 |
| Decile 1 | 63.8403 |
| Minimum | 0 |
|
|
- Mean = 128.321
- Std.dev = 55.9569
- 466 items above graph maximum of 331.481
|
