Data
457,927 items of data are available, covering 210,739 participants.
Defined-instances run from 0 to 4, labelled using Instancing
1.
Units of measurement are g.
| Maximum | 256.936 |
| Decile 9 | 42.9315 |
| Decile 8 | 35.7171 |
| Decile 7 | 31.1696 |
| Decile 6 | 27.6627 |
| Median | 24.6334 |
| Decile 4 | 21.834 |
| Decile 3 | 19.0739 |
| Decile 2 | 16.1078 |
| Decile 1 | 12.4576 |
| Minimum | 0 |
|

|
- Mean = 26.5921
- Std.dev = 12.7961
- 2407 items above graph maximum of 73.4055
|
5 Instances
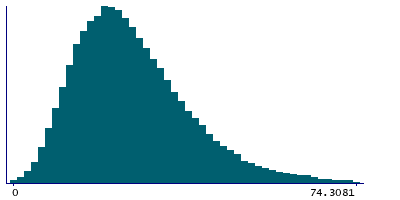
Instance 0 : Conducted in assessment centre, April 2009 to September 2010.
70,630 participants, 70,630 items
| Maximum | 219.345 |
| Decile 9 | 42.979 |
| Decile 8 | 35.5089 |
| Decile 7 | 30.8043 |
| Decile 6 | 27.0949 |
| Median | 23.9809 |
| Decile 4 | 21.1323 |
| Decile 3 | 18.32 |
| Decile 2 | 15.3097 |
| Decile 1 | 11.6468 |
| Minimum | 0 |
|
|
- Mean = 26.1215
- Std.dev = 13.2678
- 417 items above graph maximum of 74.3112
|
Instance 1 : On-line cycle 1, February 2011 to April 2011.
100,447 participants, 100,447 items
| Maximum | 207.386 |
| Decile 9 | 42.8696 |
| Decile 8 | 35.739 |
| Decile 7 | 31.278 |
| Decile 6 | 27.7556 |
| Median | 24.7579 |
| Decile 4 | 21.9698 |
| Decile 3 | 19.2562 |
| Decile 2 | 16.2994 |
| Decile 1 | 12.641 |
| Minimum | 0 |
|

|
- Mean = 26.6766
- Std.dev = 12.6295
- 495 items above graph maximum of 73.0982
|
Instance 2 : On-line cycle 2, June 2011 to September 2011.
83,140 participants, 83,140 items
| Maximum | 256.199 |
| Decile 9 | 42.8881 |
| Decile 8 | 35.6474 |
| Decile 7 | 31.0915 |
| Decile 6 | 27.6056 |
| Median | 24.5901 |
| Decile 4 | 21.8013 |
| Decile 3 | 19.0648 |
| Decile 2 | 16.1128 |
| Decile 1 | 12.4593 |
| Minimum | 0 |
|

|
- Mean = 26.5654
- Std.dev = 12.7687
- 428 items above graph maximum of 73.3168
|
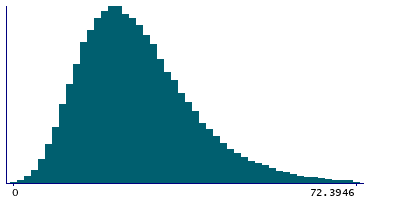
Instance 3 : On-line cycle 3, October 2011 to December 2011.
103,616 participants, 103,616 items
| Maximum | 175.461 |
| Decile 9 | 42.4956 |
| Decile 8 | 35.4235 |
| Decile 7 | 30.9754 |
| Decile 6 | 27.5639 |
| Median | 24.581 |
| Decile 4 | 21.8015 |
| Decile 3 | 19.0859 |
| Decile 2 | 16.1469 |
| Decile 1 | 12.5965 |
| Minimum | 0 |
|
|
- Mean = 26.4635
- Std.dev = 12.5008
- 527 items above graph maximum of 72.3948
|
Instance 4 : On-line cycle 4, April 2012 to June 2012.
100,094 participants, 100,094 items
| Maximum | 256.936 |
| Decile 9 | 43.4522 |
| Decile 8 | 36.1791 |
| Decile 7 | 31.5938 |
| Decile 6 | 28.0549 |
| Median | 25.0465 |
| Decile 4 | 22.2344 |
| Decile 3 | 19.4108 |
| Decile 2 | 16.4533 |
| Decile 1 | 12.7418 |
| Minimum | 0 |
|

|
- Mean = 26.9946
- Std.dev = 12.9338
- 538 items above graph maximum of 74.1625
|
