Data
457,927 items of data are available, covering 210,739 participants.
Defined-instances run from 0 to 4, labelled using Instancing
1.
Units of measurement are mg.
| Maximum | 17.1165 |
| Decile 9 | 2.81631 |
| Decile 8 | 2.3917 |
| Decile 7 | 2.12434 |
| Decile 6 | 1.91648 |
| Median | 1.73396 |
| Decile 4 | 1.5639 |
| Decile 3 | 1.39574 |
| Decile 2 | 1.21317 |
| Decile 1 | 0.980897 |
| Minimum | 0 |
|
|
- Mean = 1.85198
- Std.dev = 0.826925
- 4071 items above graph maximum of 4.65172
|
5 Instances
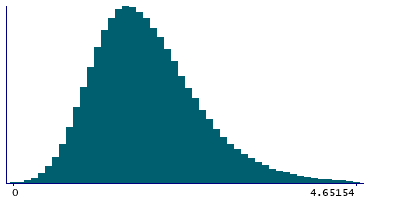
Instance 0 : Conducted in assessment centre, April 2009 to September 2010.
70,630 participants, 70,630 items
| Maximum | 17.1165 |
| Decile 9 | 2.84518 |
| Decile 8 | 2.40286 |
| Decile 7 | 2.11747 |
| Decile 6 | 1.90686 |
| Median | 1.71688 |
| Decile 4 | 1.54155 |
| Decile 3 | 1.36583 |
| Decile 2 | 1.17918 |
| Decile 1 | 0.933547 |
| Minimum | 0 |
|
|
- Mean = 1.84242
- Std.dev = 0.86853
- 671 items above graph maximum of 4.75682
|
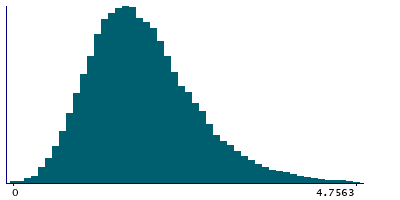
Instance 1 : On-line cycle 1, February 2011 to April 2011.
100,447 participants, 100,447 items
| Maximum | 13.6413 |
| Decile 9 | 2.8397 |
| Decile 8 | 2.42095 |
| Decile 7 | 2.15613 |
| Decile 6 | 1.94886 |
| Median | 1.76332 |
| Decile 4 | 1.59335 |
| Decile 3 | 1.42456 |
| Decile 2 | 1.24139 |
| Decile 1 | 1.00891 |
| Minimum | 0 |
|

|
- Mean = 1.8781
- Std.dev = 0.815987
- 829 items above graph maximum of 4.67049
|
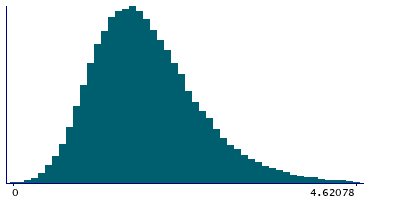
Instance 2 : On-line cycle 2, June 2011 to September 2011.
83,140 participants, 83,140 items
| Maximum | 12.6528 |
| Decile 9 | 2.79576 |
| Decile 8 | 2.3703 |
| Decile 7 | 2.10461 |
| Decile 6 | 1.89714 |
| Median | 1.71544 |
| Decile 4 | 1.54846 |
| Decile 3 | 1.37863 |
| Decile 2 | 1.19675 |
| Decile 1 | 0.970076 |
| Minimum | 0 |
|
|
- Mean = 1.83471
- Std.dev = 0.820169
- 748 items above graph maximum of 4.62145
|
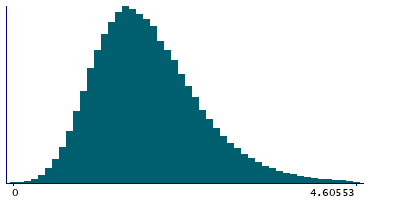
Instance 3 : On-line cycle 3, October 2011 to December 2011.
103,616 participants, 103,616 items
| Maximum | 12.4565 |
| Decile 9 | 2.79674 |
| Decile 8 | 2.37895 |
| Decile 7 | 2.11694 |
| Decile 6 | 1.90945 |
| Median | 1.72934 |
| Decile 4 | 1.56098 |
| Decile 3 | 1.39536 |
| Decile 2 | 1.21501 |
| Decile 1 | 0.988095 |
| Minimum | 0 |
|
|
- Mean = 1.84547
- Std.dev = 0.815751
- 908 items above graph maximum of 4.60538
|
Instance 4 : On-line cycle 4, April 2012 to June 2012.
100,094 participants, 100,094 items
| Maximum | 15.523 |
| Decile 9 | 2.81246 |
| Decile 8 | 2.3875 |
| Decile 7 | 2.12118 |
| Decile 6 | 1.915 |
| Median | 1.73485 |
| Decile 4 | 1.56658 |
| Decile 3 | 1.40031 |
| Decile 2 | 1.2208 |
| Decile 1 | 0.987891 |
| Minimum | 0 |
|

|
- Mean = 1.85358
- Std.dev = 0.824173
- 882 items above graph maximum of 4.63703
|
