Data
457,927 items of data are available, covering 210,739 participants.
Defined-instances run from 0 to 4, labelled using Instancing
1.
Units of measurement are mg.
| Maximum | 13463.4 |
| Decile 9 | 1975.61 |
| Decile 8 | 1749.19 |
| Decile 7 | 1603.1 |
| Decile 6 | 1488.31 |
| Median | 1385.57 |
| Decile 4 | 1288.09 |
| Decile 3 | 1188.02 |
| Decile 2 | 1073.72 |
| Decile 1 | 918.019 |
| Minimum | 0 |
|

|
- Mean = 1426.85
- Std.dev = 442.106
- 1916 items above graph maximum of 3033.2
|
5 Instances
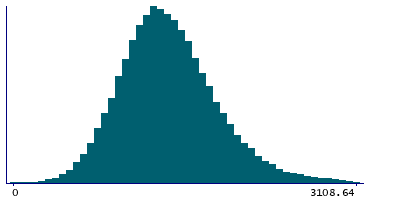
Instance 0 : Conducted in assessment centre, April 2009 to September 2010.
70,630 participants, 70,630 items
| Maximum | 13463.4 |
| Decile 9 | 1995.36 |
| Decile 8 | 1758.08 |
| Decile 7 | 1604.18 |
| Decile 6 | 1483.67 |
| Median | 1375.21 |
| Decile 4 | 1271.98 |
| Decile 3 | 1166.03 |
| Decile 2 | 1046.92 |
| Decile 1 | 882.088 |
| Minimum | 0 |
|
|
- Mean = 1420.2
- Std.dev = 473.548
- 352 items above graph maximum of 3108.64
|
Instance 1 : On-line cycle 1, February 2011 to April 2011.
100,447 participants, 100,447 items
| Maximum | 8965.8 |
| Decile 9 | 1980.86 |
| Decile 8 | 1757.82 |
| Decile 7 | 1612.36 |
| Decile 6 | 1498.48 |
| Median | 1395.96 |
| Decile 4 | 1298.89 |
| Decile 3 | 1200.15 |
| Decile 2 | 1086.34 |
| Decile 1 | 931.045 |
| Minimum | 0 |
|

|
- Mean = 1436.14
- Std.dev = 435.694
- 377 items above graph maximum of 3030.67
|
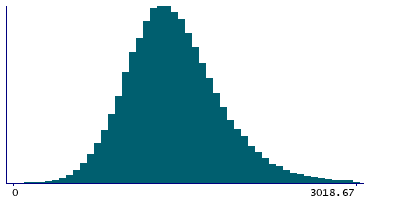
Instance 2 : On-line cycle 2, June 2011 to September 2011.
83,140 participants, 83,140 items
| Maximum | 11169.7 |
| Decile 9 | 1968.96 |
| Decile 8 | 1740.62 |
| Decile 7 | 1596.5 |
| Decile 6 | 1481.28 |
| Median | 1380.38 |
| Decile 4 | 1283.35 |
| Decile 3 | 1185.49 |
| Decile 2 | 1071.23 |
| Decile 1 | 919.094 |
| Minimum | 0 |
|
|
- Mean = 1421.94
- Std.dev = 438.14
- 347 items above graph maximum of 3018.83
|
Instance 3 : On-line cycle 3, October 2011 to December 2011.
103,616 participants, 103,616 items
| Maximum | 8775.08 |
| Decile 9 | 1961.6 |
| Decile 8 | 1739.57 |
| Decile 7 | 1594.27 |
| Decile 6 | 1481.92 |
| Median | 1380.64 |
| Decile 4 | 1284.2 |
| Decile 3 | 1184.41 |
| Decile 2 | 1072.66 |
| Decile 1 | 919.09 |
| Minimum | 0 |
|

|
- Mean = 1420.09
- Std.dev = 431.254
- 395 items above graph maximum of 3004.12
|
Instance 4 : On-line cycle 4, April 2012 to June 2012.
100,094 participants, 100,094 items
| Maximum | 10918.6 |
| Decile 9 | 1977.76 |
| Decile 8 | 1750.96 |
| Decile 7 | 1607.06 |
| Decile 6 | 1493.23 |
| Median | 1391.42 |
| Decile 4 | 1295.83 |
| Decile 3 | 1196.69 |
| Decile 2 | 1083.55 |
| Decile 1 | 928.335 |
| Minimum | 0 |
|

|
- Mean = 1433.31
- Std.dev = 439.629
- 442 items above graph maximum of 3027.19
|
