Data
457,927 items of data are available, covering 210,739 participants.
Defined-instances run from 0 to 4, labelled using Instancing
1.
Units of measurement are ug.
| Maximum | 48752.6 |
| Decile 9 | 6230.34 |
| Decile 8 | 5042.1 |
| Decile 7 | 3029.32 |
| Decile 6 | 2077.38 |
| Median | 1464.61 |
| Decile 4 | 1057.13 |
| Decile 3 | 761.498 |
| Decile 2 | 529.849 |
| Decile 1 | 337.212 |
| Minimum | 0 |
|
|
- Mean = 2624.75
- Std.dev = 2854.07
- 5554 items above graph maximum of 12123.5
|
5 Instances
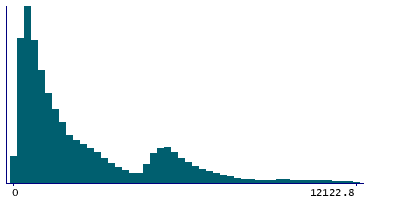
Instance 0 : Conducted in assessment centre, April 2009 to September 2010.
70,630 participants, 70,630 items
| Maximum | 43971.4 |
| Decile 9 | 6480.47 |
| Decile 8 | 5164.78 |
| Decile 7 | 3124.14 |
| Decile 6 | 2095.37 |
| Median | 1412.11 |
| Decile 4 | 997.259 |
| Decile 3 | 698.794 |
| Decile 2 | 474.178 |
| Decile 1 | 299.327 |
| Minimum | 0 |
|
|
- Mean = 2681.81
- Std.dev = 3005.72
- 871 items above graph maximum of 12661.6
|
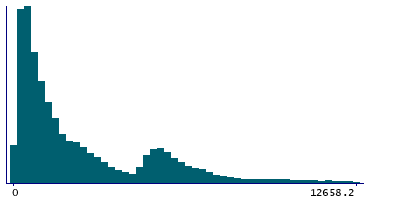
Instance 1 : On-line cycle 1, February 2011 to April 2011.
100,447 participants, 100,447 items
| Maximum | 48752.6 |
| Decile 9 | 6349.15 |
| Decile 8 | 5177.66 |
| Decile 7 | 3259.9 |
| Decile 6 | 2225.49 |
| Median | 1549.06 |
| Decile 4 | 1102.72 |
| Decile 3 | 786.473 |
| Decile 2 | 545.068 |
| Decile 1 | 345.968 |
| Minimum | 0 |
|
|
- Mean = 2732.35
- Std.dev = 2934.6
- 1213 items above graph maximum of 12352.3
|
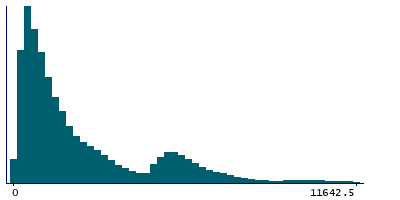
Instance 2 : On-line cycle 2, June 2011 to September 2011.
83,140 participants, 83,140 items
| Maximum | 44693.9 |
| Decile 9 | 5997.67 |
| Decile 8 | 4682.52 |
| Decile 7 | 2725.09 |
| Decile 6 | 1892.27 |
| Median | 1395.75 |
| Decile 4 | 1044 |
| Decile 3 | 776.527 |
| Decile 2 | 549.111 |
| Decile 1 | 352.136 |
| Minimum | 0 |
|
|
- Mean = 2462.67
- Std.dev = 2678.5
- 974 items above graph maximum of 11643.2
|
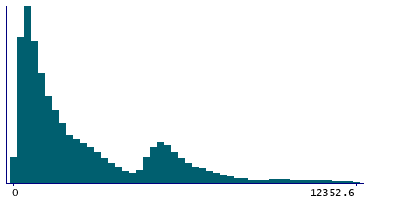
Instance 3 : On-line cycle 3, October 2011 to December 2011.
103,616 participants, 103,616 items
| Maximum | 45521.6 |
| Decile 9 | 6328.57 |
| Decile 8 | 5156.98 |
| Decile 7 | 3260.27 |
| Decile 6 | 2233.98 |
| Median | 1568.07 |
| Decile 4 | 1106.44 |
| Decile 3 | 779.998 |
| Decile 2 | 538.123 |
| Decile 1 | 341.335 |
| Minimum | 0 |
|
|
- Mean = 2722.54
- Std.dev = 2887.6
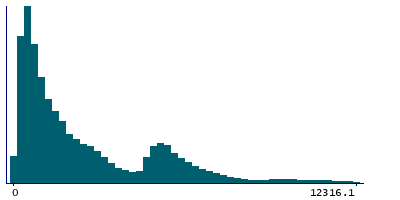
- 1248 items above graph maximum of 12315.8
|
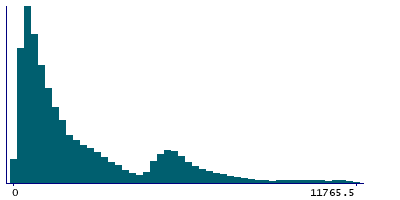
Instance 4 : On-line cycle 4, April 2012 to June 2012.
100,094 participants, 100,094 items
| Maximum | 48675.6 |
| Decile 9 | 6054.69 |
| Decile 8 | 4854.19 |
| Decile 7 | 2828.03 |
| Decile 6 | 1932.34 |
| Median | 1387.78 |
| Decile 4 | 1020.6 |
| Decile 3 | 748.341 |
| Decile 2 | 531.379 |
| Decile 1 | 342.717 |
| Minimum | 0 |
|
|
- Mean = 2509.9
- Std.dev = 2756.73
- 1162 items above graph maximum of 11766.7
|
