Data
457,927 items of data are available, covering 210,739 participants.
Defined-instances run from 0 to 4, labelled using Instancing
1.
Units of measurement are ug.
| Maximum | 12726.5 |
| Decile 9 | 267.691 |
| Decile 8 | 197.139 |
| Decile 7 | 155.463 |
| Decile 6 | 126.439 |
| Median | 98.204 |
| Decile 4 | 72.1938 |
| Decile 3 | 51.6998 |
| Decile 2 | 26.7 |
| Decile 1 | 9.04 |
| Minimum | 0 |
|
|
- Mean = 175.613
- Std.dev = 479.722
- 11156 items above graph maximum of 526.343
|
5 Instances
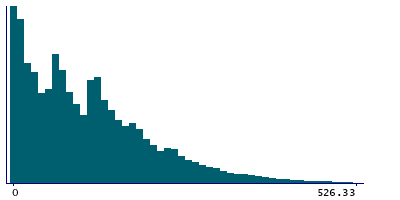
Instance 0 : Conducted in assessment centre, April 2009 to September 2010.
70,630 participants, 70,630 items
| Maximum | 12598.7 |
| Decile 9 | 271.623 |
| Decile 8 | 199.662 |
| Decile 7 | 155.166 |
| Decile 6 | 125.269 |
| Median | 95.3662 |
| Decile 4 | 69.97 |
| Decile 3 | 45.925 |
| Decile 2 | 22.615 |
| Decile 1 | 6.1475 |
| Minimum | 0 |
|
|
- Mean = 171.66
- Std.dev = 476.323
- 1594 items above graph maximum of 537.099
|
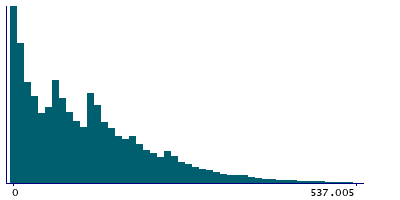
Instance 1 : On-line cycle 1, February 2011 to April 2011.
100,447 participants, 100,447 items
| Maximum | 12657.1 |
| Decile 9 | 278.239 |
| Decile 8 | 204.667 |
| Decile 7 | 162.521 |
| Decile 6 | 130.86 |
| Median | 106.222 |
| Decile 4 | 75.825 |
| Decile 3 | 55.6875 |
| Decile 2 | 28.84 |
| Decile 1 | 10.3 |
| Minimum | 0 |
|

|
- Mean = 186.735
- Std.dev = 503.734
- 2647 items above graph maximum of 546.178
|
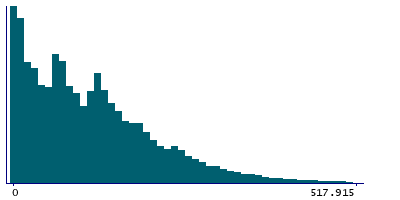
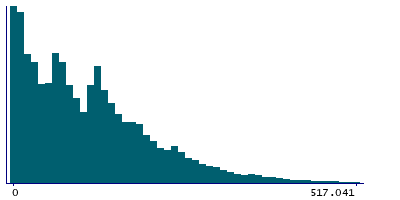
Instance 2 : On-line cycle 2, June 2011 to September 2011.
83,140 participants, 83,140 items
| Maximum | 12726.5 |
| Decile 9 | 264.066 |
| Decile 8 | 196.98 |
| Decile 7 | 156.283 |
| Decile 6 | 127.5 |
| Median | 99.165 |
| Decile 4 | 73.2588 |
| Decile 3 | 53.2 |
| Decile 2 | 27.8163 |
| Decile 1 | 10.23 |
| Minimum | 0 |
|
|
- Mean = 155.07
- Std.dev = 379.029
- 1457 items above graph maximum of 517.902
|
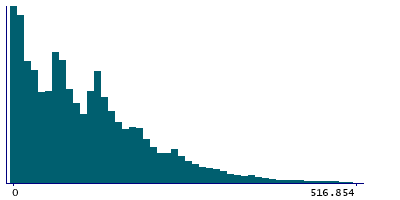
Instance 3 : On-line cycle 3, October 2011 to December 2011.
103,616 participants, 103,616 items
| Maximum | 12364.1 |
| Decile 9 | 262.717 |
| Decile 8 | 191.298 |
| Decile 7 | 149.679 |
| Decile 6 | 122.85 |
| Median | 93.3675 |
| Decile 4 | 70.3 |
| Decile 3 | 49.65 |
| Decile 2 | 25.6575 |
| Decile 1 | 8.69 |
| Minimum | 0 |
|
|
- Mean = 192.419
- Std.dev = 555.964
- 3250 items above graph maximum of 516.744
|
Instance 4 : On-line cycle 4, April 2012 to June 2012.
100,094 participants, 100,094 items
| Maximum | 12415.9 |
| Decile 9 | 263.482 |
| Decile 8 | 194.354 |
| Decile 7 | 153.514 |
| Decile 6 | 125.75 |
| Median | 97.485 |
| Decile 4 | 71.9618 |
| Decile 3 | 51.105 |
| Decile 2 | 26.775 |
| Decile 1 | 9.84 |
| Minimum | 0 |
|
|
- Mean = 166.908
- Std.dev = 444.925
- 2198 items above graph maximum of 517.124
|
