Data
457,927 items of data are available, covering 210,739 participants.
Defined-instances run from 0 to 4, labelled using Instancing
1.
Units of measurement are ug.
| Maximum | 360.904 |
| Decile 9 | 65.9571 |
| Decile 8 | 55.0675 |
| Decile 7 | 48.6832 |
| Decile 6 | 43.9262 |
| Median | 39.8908 |
| Decile 4 | 36.19 |
| Decile 3 | 32.5535 |
| Decile 2 | 28.6113 |
| Decile 1 | 23.6535 |
| Minimum | 0 |
|

|
- Mean = 43.333
- Std.dev = 19.723
- 5793 items above graph maximum of 108.261
|
5 Instances
Instance 0 : Conducted in assessment centre, April 2009 to September 2010.
70,630 participants, 70,630 items
| Maximum | 327.99 |
| Decile 9 | 65.6333 |
| Decile 8 | 54.52 |
| Decile 7 | 48.0418 |
| Decile 6 | 43.1426 |
| Median | 39.0385 |
| Decile 4 | 35.2667 |
| Decile 3 | 31.5774 |
| Decile 2 | 27.5006 |
| Decile 1 | 22.3888 |
| Minimum | 0 |
|
|
- Mean = 42.5984
- Std.dev = 20.3553
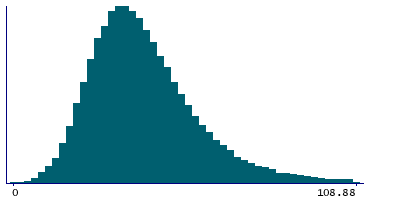
- 890 items above graph maximum of 108.878
|
Instance 1 : On-line cycle 1, February 2011 to April 2011.
100,447 participants, 100,447 items
| Maximum | 291.909 |
| Decile 9 | 66.2503 |
| Decile 8 | 55.4622 |
| Decile 7 | 49.1564 |
| Decile 6 | 44.3506 |
| Median | 40.3509 |
| Decile 4 | 36.6694 |
| Decile 3 | 33.0306 |
| Decile 2 | 29.057 |
| Decile 1 | 24.0394 |
| Minimum | 0 |
|

|
- Mean = 43.6843
- Std.dev = 19.3743
- 1166 items above graph maximum of 108.461
|
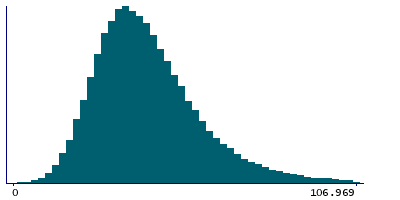
Instance 2 : On-line cycle 2, June 2011 to September 2011.
83,140 participants, 83,140 items
| Maximum | 360.904 |
| Decile 9 | 65.3027 |
| Decile 8 | 54.6014 |
| Decile 7 | 48.3694 |
| Decile 6 | 43.6504 |
| Median | 39.6556 |
| Decile 4 | 35.9859 |
| Decile 3 | 32.4177 |
| Decile 2 | 28.534 |
| Decile 1 | 23.6334 |
| Minimum | 0 |
|
|
- Mean = 43.0802
- Std.dev = 19.6162
- 1115 items above graph maximum of 106.972
|
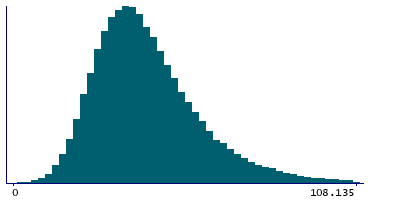
Instance 3 : On-line cycle 3, October 2011 to December 2011.
103,616 participants, 103,616 items
| Maximum | 272.143 |
| Decile 9 | 65.9368 |
| Decile 8 | 55.0283 |
| Decile 7 | 48.5801 |
| Decile 6 | 43.8199 |
| Median | 39.7666 |
| Decile 4 | 36.1115 |
| Decile 3 | 32.4963 |
| Decile 2 | 28.603 |
| Decile 1 | 23.7315 |
| Minimum | 0 |
|
|
- Mean = 43.2993
- Std.dev = 19.6575
- 1355 items above graph maximum of 108.142
|
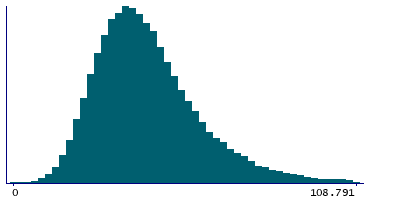
Instance 4 : On-line cycle 4, April 2012 to June 2012.
100,094 participants, 100,094 items
| Maximum | 303.351 |
| Decile 9 | 66.4179 |
| Decile 8 | 55.4222 |
| Decile 7 | 49.0246 |
| Decile 6 | 44.3219 |
| Median | 40.3273 |
| Decile 4 | 36.6073 |
| Decile 3 | 32.9514 |
| Decile 2 | 29.0179 |
| Decile 1 | 24.0566 |
| Minimum | 0 |
|
|
- Mean = 43.7436
- Std.dev = 19.7543
- 1279 items above graph maximum of 108.779
|
