Data
457,927 items of data are available, covering 210,739 participants.
Defined-instances run from 0 to 4, labelled using Instancing
1.
Units of measurement are mg.
| Maximum | 32813.3 |
| Decile 9 | 5196.07 |
| Decile 8 | 4348.12 |
| Decile 7 | 3848.23 |
| Decile 6 | 3469.99 |
| Median | 3149.88 |
| Decile 4 | 2860.26 |
| Decile 3 | 2575.08 |
| Decile 2 | 2264.55 |
| Decile 1 | 1863.94 |
| Minimum | 0 |
|

|
- Mean = 3385.29
- Std.dev = 1412.55
- 2668 items above graph maximum of 8528.2
|
5 Instances
Instance 0 : Conducted in assessment centre, April 2009 to September 2010.
70,630 participants, 70,630 items
| Maximum | 25636.8 |
| Decile 9 | 5177.43 |
| Decile 8 | 4313.6 |
| Decile 7 | 3805.72 |
| Decile 6 | 3420.89 |
| Median | 3096.87 |
| Decile 4 | 2799.97 |
| Decile 3 | 2511.12 |
| Decile 2 | 2194.41 |
| Decile 1 | 1791.79 |
| Minimum | 0 |
|
|
- Mean = 3337.12
- Std.dev = 1444.21
- 417 items above graph maximum of 8563.07
|
Instance 1 : On-line cycle 1, February 2011 to April 2011.
100,447 participants, 100,447 items
| Maximum | 18756.7 |
| Decile 9 | 5203.54 |
| Decile 8 | 4366.7 |
| Decile 7 | 3874.89 |
| Decile 6 | 3495.37 |
| Median | 3175.36 |
| Decile 4 | 2887.45 |
| Decile 3 | 2605.12 |
| Decile 2 | 2295.27 |
| Decile 1 | 1895.61 |
| Minimum | 0 |
|

|
- Mean = 3409.32
- Std.dev = 1402.84
- 599 items above graph maximum of 8511.47
|
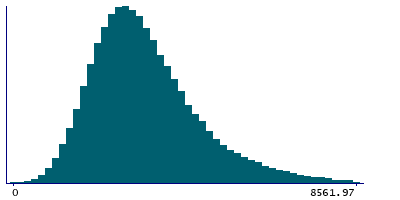
Instance 2 : On-line cycle 2, June 2011 to September 2011.
83,140 participants, 83,140 items
| Maximum | 21926.6 |
| Decile 9 | 5206.14 |
| Decile 8 | 4354.07 |
| Decile 7 | 3853.22 |
| Decile 6 | 3474.89 |
| Median | 3156.99 |
| Decile 4 | 2865.59 |
| Decile 3 | 2577.92 |
| Decile 2 | 2266.39 |
| Decile 1 | 1864.19 |
| Minimum | 0 |
|

|
- Mean = 3390.41
- Std.dev = 1412.51
- 464 items above graph maximum of 8548.08
|
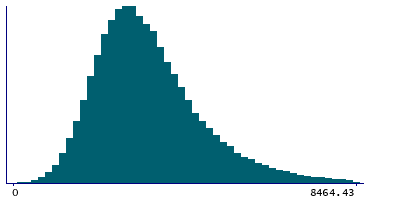
Instance 3 : On-line cycle 3, October 2011 to December 2011.
103,616 participants, 103,616 items
| Maximum | 20166.3 |
| Decile 9 | 5167.31 |
| Decile 8 | 4324.5 |
| Decile 7 | 3826.85 |
| Decile 6 | 3457.91 |
| Median | 3141.78 |
| Decile 4 | 2853.2 |
| Decile 3 | 2569.23 |
| Decile 2 | 2263.35 |
| Decile 1 | 1868.46 |
| Minimum | 0 |
|
|
- Mean = 3372
- Std.dev = 1391.64
- 563 items above graph maximum of 8466.16
|
Instance 4 : On-line cycle 4, April 2012 to June 2012.
100,094 participants, 100,094 items
| Maximum | 32813.3 |
| Decile 9 | 5226.05 |
| Decile 8 | 4370.93 |
| Decile 7 | 3867.06 |
| Decile 6 | 3486.77 |
| Median | 3165.58 |
| Decile 4 | 2877.07 |
| Decile 3 | 2593.2 |
| Decile 2 | 2283.59 |
| Decile 1 | 1882.21 |
| Minimum | 0 |
|

|
- Mean = 3404.68
- Std.dev = 1420.2
- 618 items above graph maximum of 8569.89
|
