Data
457,927 items of data are available, covering 210,739 participants.
Defined-instances run from 0 to 4, labelled using Instancing
1.
Units of measurement are mg.
| Maximum | 15.9568 |
| Decile 9 | 2.06305 |
| Decile 8 | 1.73928 |
| Decile 7 | 1.55283 |
| Decile 6 | 1.41362 |
| Median | 1.29428 |
| Decile 4 | 1.1833 |
| Decile 3 | 1.07231 |
| Decile 2 | 0.951521 |
| Decile 1 | 0.795057 |
| Minimum | 0 |
|

|
- Mean = 1.39503
- Std.dev = 0.611782
- 6991 items above graph maximum of 3.33105
|
5 Instances
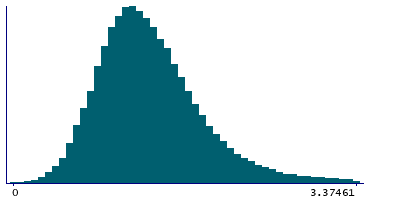
Instance 0 : Conducted in assessment centre, April 2009 to September 2010.
70,630 participants, 70,630 items
| Maximum | 15.602 |
| Decile 9 | 2.06958 |
| Decile 8 | 1.74407 |
| Decile 7 | 1.5561 |
| Decile 6 | 1.41007 |
| Median | 1.28523 |
| Decile 4 | 1.16867 |
| Decile 3 | 1.05438 |
| Decile 2 | 0.929973 |
| Decile 1 | 0.764652 |
| Minimum | 0 |
|
|
- Mean = 1.38475
- Std.dev = 0.625056
- 962 items above graph maximum of 3.37451
|
Instance 1 : On-line cycle 1, February 2011 to April 2011.
100,447 participants, 100,447 items
| Maximum | 13.5216 |
| Decile 9 | 2.07326 |
| Decile 8 | 1.7455 |
| Decile 7 | 1.56128 |
| Decile 6 | 1.42135 |
| Median | 1.30434 |
| Decile 4 | 1.19327 |
| Decile 3 | 1.08239 |
| Decile 2 | 0.96064 |
| Decile 1 | 0.807761 |
| Minimum | 0 |
|

|
- Mean = 1.40444
- Std.dev = 0.609027
- 1530 items above graph maximum of 3.33876
|
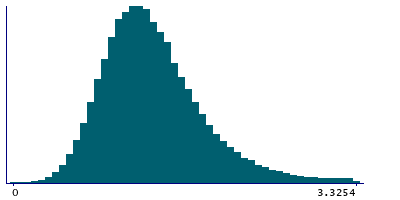
Instance 2 : On-line cycle 2, June 2011 to September 2011.
83,140 participants, 83,140 items
| Maximum | 13.4823 |
| Decile 9 | 2.05142 |
| Decile 8 | 1.72978 |
| Decile 7 | 1.54768 |
| Decile 6 | 1.40908 |
| Median | 1.29203 |
| Decile 4 | 1.18301 |
| Decile 3 | 1.07184 |
| Decile 2 | 0.95258 |
| Decile 1 | 0.795578 |
| Minimum | 0 |
|

|
- Mean = 1.39135
- Std.dev = 0.609487
- 1283 items above graph maximum of 3.30726
|
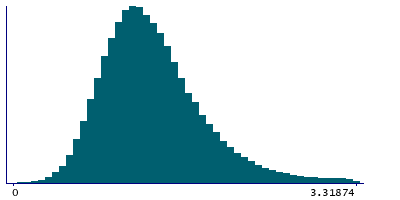
Instance 3 : On-line cycle 3, October 2011 to December 2011.
103,616 participants, 103,616 items
| Maximum | 12.5201 |
| Decile 9 | 2.05749 |
| Decile 8 | 1.7367 |
| Decile 7 | 1.54792 |
| Decile 6 | 1.40908 |
| Median | 1.28965 |
| Decile 4 | 1.18002 |
| Decile 3 | 1.0708 |
| Decile 2 | 0.950395 |
| Decile 1 | 0.796289 |
| Minimum | 0 |
|
|
- Mean = 1.39302
- Std.dev = 0.60877
- 1649 items above graph maximum of 3.31869
|
Instance 4 : On-line cycle 4, April 2012 to June 2012.
100,094 participants, 100,094 items
| Maximum | 15.9568 |
| Decile 9 | 2.06329 |
| Decile 8 | 1.74042 |
| Decile 7 | 1.55214 |
| Decile 6 | 1.4159 |
| Median | 1.29626 |
| Decile 4 | 1.18689 |
| Decile 3 | 1.07652 |
| Decile 2 | 0.95708 |
| Decile 1 | 0.801538 |
| Minimum | 0 |
|
|
- Mean = 1.39796
- Std.dev = 0.609928
- 1568 items above graph maximum of 3.32503
|
