Data
457,927 items of data are available, covering 210,739 participants.
Defined-instances run from 0 to 4, labelled using Instancing
1.
Units of measurement are g.
| Maximum | 338.658 |
| Decile 9 | 44.6305 |
| Decile 8 | 36.6198 |
| Decile 7 | 31.6144 |
| Decile 6 | 27.765 |
| Median | 24.4283 |
| Decile 4 | 21.2649 |
| Decile 3 | 18.0897 |
| Decile 2 | 14.6408 |
| Decile 1 | 10.3605 |
| Minimum | 0 |
|

|
- Mean = 26.4641
- Std.dev = 14.4816
- 2700 items above graph maximum of 78.9004
|
5 Instances
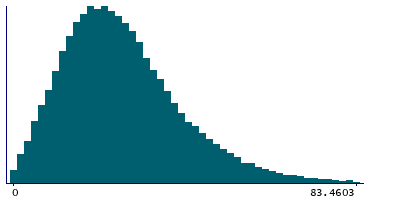
Instance 0 : Conducted in assessment centre, April 2009 to September 2010.
70,630 participants, 70,630 items
| Maximum | 338.658 |
| Decile 9 | 46.6536 |
| Decile 8 | 37.7211 |
| Decile 7 | 32.2482 |
| Decile 6 | 28.1533 |
| Median | 24.559 |
| Decile 4 | 21.2024 |
| Decile 3 | 17.8554 |
| Decile 2 | 14.2599 |
| Decile 1 | 9.84933 |
| Minimum | 0 |
|
|
- Mean = 26.976
- Std.dev = 15.8486
- 471 items above graph maximum of 83.458
|
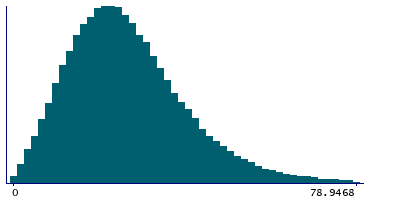
Instance 1 : On-line cycle 1, February 2011 to April 2011.
100,447 participants, 100,447 items
| Maximum | 193.209 |
| Decile 9 | 44.6857 |
| Decile 8 | 36.7655 |
| Decile 7 | 31.7515 |
| Decile 6 | 27.8938 |
| Median | 24.5286 |
| Decile 4 | 21.3864 |
| Decile 3 | 18.198 |
| Decile 2 | 14.7093 |
| Decile 1 | 10.4207 |
| Minimum | 0 |
|
|
- Mean = 26.5392
- Std.dev = 14.3576
- 545 items above graph maximum of 78.9507
|
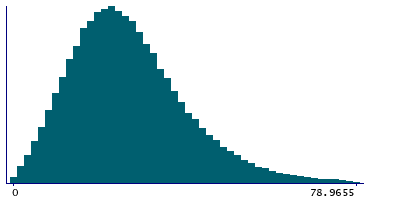
Instance 2 : On-line cycle 2, June 2011 to September 2011.
83,140 participants, 83,140 items
| Maximum | 220.266 |
| Decile 9 | 44.9442 |
| Decile 8 | 36.9618 |
| Decile 7 | 32.0863 |
| Decile 6 | 28.271 |
| Median | 24.9701 |
| Decile 4 | 21.8439 |
| Decile 3 | 18.7048 |
| Decile 2 | 15.2895 |
| Decile 1 | 10.9071 |
| Minimum | 0 |
|
|
- Mean = 26.9266
- Std.dev = 14.3091
- 494 items above graph maximum of 78.9812
|
Instance 3 : On-line cycle 3, October 2011 to December 2011.
103,616 participants, 103,616 items
| Maximum | 189.33 |
| Decile 9 | 43.2558 |
| Decile 8 | 35.6092 |
| Decile 7 | 30.7716 |
| Decile 6 | 27.0112 |
| Median | 23.7746 |
| Decile 4 | 20.672 |
| Decile 3 | 17.5636 |
| Decile 2 | 14.2004 |
| Decile 1 | 10.0513 |
| Minimum | 0 |
|

|
- Mean = 25.7132
- Std.dev = 13.9803
- 610 items above graph maximum of 76.4603
|
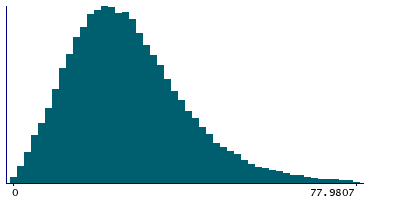
Instance 4 : On-line cycle 4, April 2012 to June 2012.
100,094 participants, 100,094 items
| Maximum | 315.057 |
| Decile 9 | 44.2626 |
| Decile 8 | 36.4538 |
| Decile 7 | 31.5672 |
| Decile 6 | 27.7138 |
| Median | 24.4765 |
| Decile 4 | 21.3159 |
| Decile 3 | 18.1822 |
| Decile 2 | 14.7788 |
| Decile 1 | 10.5487 |
| Minimum | 0 |
|
|
- Mean = 26.4207
- Std.dev = 14.2123
- 572 items above graph maximum of 77.9765
|
