Data
457,927 items of data are available, covering 210,739 participants.
Defined-instances run from 0 to 4, labelled using Instancing
1.
Units of measurement are g.
| Maximum | 151.923 |
| Decile 9 | 24.6613 |
| Decile 8 | 20.0318 |
| Decile 7 | 17.1176 |
| Decile 6 | 14.8198 |
| Median | 12.8514 |
| Decile 4 | 10.946 |
| Decile 3 | 8.97877 |
| Decile 2 | 6.80181 |
| Decile 1 | 4.03125 |
| Minimum | 0 |
|
|
- Mean = 13.848
- Std.dev = 8.51721
- 2103 items above graph maximum of 45.2914
|
5 Instances
Instance 0 : Conducted in assessment centre, April 2009 to September 2010.
70,630 participants, 70,630 items
| Maximum | 125.037 |
| Decile 9 | 24.8622 |
| Decile 8 | 20.1322 |
| Decile 7 | 17.1938 |
| Decile 6 | 14.9145 |
| Median | 12.9492 |
| Decile 4 | 10.9951 |
| Decile 3 | 9.0326 |
| Decile 2 | 6.87925 |
| Decile 1 | 4.03125 |
| Minimum | 0 |
|

|
- Mean = 13.9608
- Std.dev = 8.72588
- 379 items above graph maximum of 45.6932
|
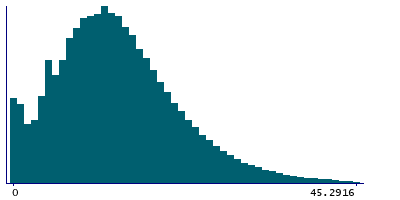
Instance 1 : On-line cycle 1, February 2011 to April 2011.
100,447 participants, 100,447 items
| Maximum | 130.624 |
| Decile 9 | 24.9656 |
| Decile 8 | 20.3423 |
| Decile 7 | 17.3607 |
| Decile 6 | 15.0455 |
| Median | 13.0625 |
| Decile 4 | 11.1441 |
| Decile 3 | 9.11426 |
| Decile 2 | 6.94954 |
| Decile 1 | 4.1341 |
| Minimum | 0 |
|
|
- Mean = 14.0641
- Std.dev = 8.58492
- 449 items above graph maximum of 45.7971
|
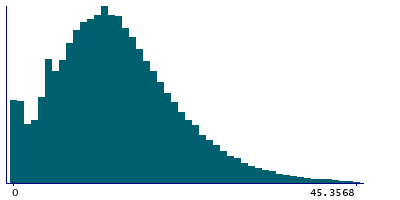
Instance 2 : On-line cycle 2, June 2011 to September 2011.
83,140 participants, 83,140 items
| Maximum | 145.547 |
| Decile 9 | 24.0485 |
| Decile 8 | 19.4758 |
| Decile 7 | 16.6093 |
| Decile 6 | 14.3531 |
| Median | 12.4377 |
| Decile 4 | 10.596 |
| Decile 3 | 8.72075 |
| Decile 2 | 6.5717 |
| Decile 1 | 3.847 |
| Minimum | 0 |
|

|
- Mean = 13.4508
- Std.dev = 8.32673
- 384 items above graph maximum of 44.2499
|
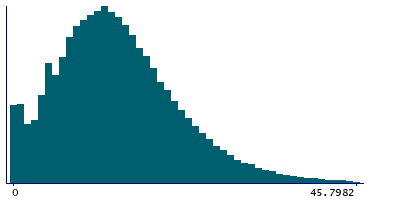
Instance 3 : On-line cycle 3, October 2011 to December 2011.
103,616 participants, 103,616 items
| Maximum | 151.923 |
| Decile 9 | 24.6943 |
| Decile 8 | 20.0875 |
| Decile 7 | 17.1549 |
| Decile 6 | 14.8472 |
| Median | 12.8689 |
| Decile 4 | 10.9751 |
| Decile 3 | 8.97246 |
| Decile 2 | 6.742 |
| Decile 1 | 4.03125 |
| Minimum | 0 |
|
|
- Mean = 13.8541
- Std.dev = 8.4892
- 444 items above graph maximum of 45.3574
|
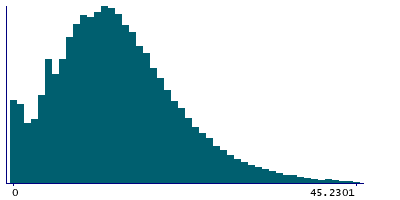
Instance 4 : On-line cycle 4, April 2012 to June 2012.
100,094 participants, 100,094 items
| Maximum | 101.988 |
| Decile 9 | 24.6465 |
| Decile 8 | 20.051 |
| Decile 7 | 17.1661 |
| Decile 6 | 14.8641 |
| Median | 12.9022 |
| Decile 4 | 10.9942 |
| Decile 3 | 9.0079 |
| Decile 2 | 6.84443 |
| Decile 1 | 4.06341 |
| Minimum | 0 |
|
|
- Mean = 13.8751
- Std.dev = 8.4742
- 452 items above graph maximum of 45.2296
|
