Data
457,927 items of data are available, covering 210,739 participants.
Defined-instances run from 0 to 4, labelled using Instancing
1.
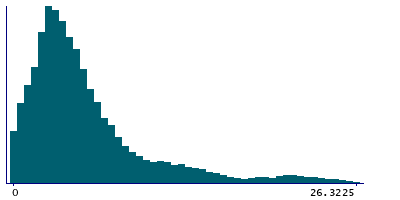
Units of measurement are g.
| Maximum | 76.9676 |
| Decile 9 | 13.8995 |
| Decile 8 | 8.6086 |
| Decile 7 | 6.49667 |
| Decile 6 | 5.27978 |
| Median | 4.38636 |
| Decile 4 | 3.61769 |
| Decile 3 | 2.921 |
| Decile 2 | 2.24547 |
| Decile 1 | 1.29067 |
| Minimum | 0 |
|

|
- Mean = 6.64852
- Std.dev = 7.65262
- 14707 items above graph maximum of 26.5083
|
5 Instances
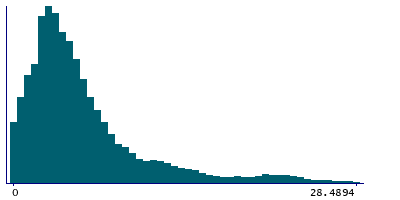
Instance 0 : Conducted in assessment centre, April 2009 to September 2010.
70,630 participants, 70,630 items
| Maximum | 76.9676 |
| Decile 9 | 14.8743 |
| Decile 8 | 9.17277 |
| Decile 7 | 6.80416 |
| Decile 6 | 5.47655 |
| Median | 4.52547 |
| Decile 4 | 3.68748 |
| Decile 3 | 2.95925 |
| Decile 2 | 2.265 |
| Decile 1 | 1.26628 |
| Minimum | 0 |
|
|
- Mean = 7.01785
- Std.dev = 8.25414
- 2481 items above graph maximum of 28.4824
|
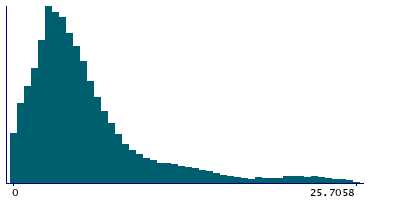
Instance 1 : On-line cycle 1, February 2011 to April 2011.
100,447 participants, 100,447 items
| Maximum | 74.5402 |
| Decile 9 | 13.5039 |
| Decile 8 | 8.3891 |
| Decile 7 | 6.40631 |
| Decile 6 | 5.23998 |
| Median | 4.36771 |
| Decile 4 | 3.61221 |
| Decile 3 | 2.92124 |
| Decile 2 | 2.25875 |
| Decile 1 | 1.29875 |
| Minimum | 0 |
|
|
- Mean = 6.52382
- Std.dev = 7.4376
- 3151 items above graph maximum of 25.709
|
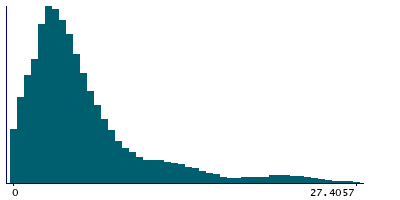
Instance 2 : On-line cycle 2, June 2011 to September 2011.
83,140 participants, 83,140 items
| Maximum | 75.5109 |
| Decile 9 | 14.3488 |
| Decile 8 | 8.93125 |
| Decile 7 | 6.63208 |
| Decile 6 | 5.36477 |
| Median | 4.43427 |
| Decile 4 | 3.6593 |
| Decile 3 | 2.94377 |
| Decile 2 | 2.24547 |
| Decile 1 | 1.28675 |
| Minimum | 0 |
|
|
- Mean = 6.80784
- Std.dev = 7.84953
- 2768 items above graph maximum of 27.4108
|
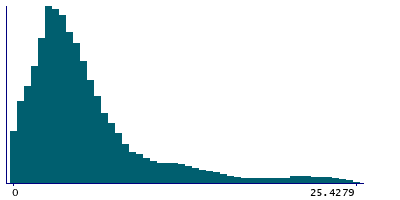
Instance 3 : On-line cycle 3, October 2011 to December 2011.
103,616 participants, 103,616 items
| Maximum | 70.5996 |
| Decile 9 | 13.3568 |
| Decile 8 | 8.26131 |
| Decile 7 | 6.29401 |
| Decile 6 | 5.15116 |
| Median | 4.30474 |
| Decile 4 | 3.5566 |
| Decile 3 | 2.88326 |
| Decile 2 | 2.21759 |
| Decile 1 | 1.28547 |
| Minimum | 0 |
|
|
- Mean = 6.43479
- Std.dev = 7.37412
- 3186 items above graph maximum of 25.4282
|
Instance 4 : On-line cycle 4, April 2012 to June 2012.
100,094 participants, 100,094 items
| Maximum | 75.89 |
| Decile 9 | 13.8131 |
| Decile 8 | 8.58315 |
| Decile 7 | 6.4881 |
| Decile 6 | 5.26051 |
| Median | 4.37229 |
| Decile 4 | 3.6022 |
| Decile 3 | 2.91784 |
| Decile 2 | 2.2522 |
| Decile 1 | 1.30509 |
| Minimum | 0 |
|
|
- Mean = 6.60194
- Std.dev = 7.52872
- 3107 items above graph maximum of 26.3211
|
