Data
457,927 items of data are available, covering 210,739 participants.
Defined-instances run from 0 to 4, labelled using Instancing
1.
Units of measurement are g.
| Maximum | 539.499 |
| Decile 9 | 98.1219 |
| Decile 8 | 82.1808 |
| Decile 7 | 71.9665 |
| Decile 6 | 63.8212 |
| Median | 56.5378 |
| Decile 4 | 49.5588 |
| Decile 3 | 42.4933 |
| Decile 2 | 34.7467 |
| Decile 1 | 25.4464 |
| Minimum | 0 |
|

|
- Mean = 60.1179
- Std.dev = 29.9407
- 2003 items above graph maximum of 170.797
|
5 Instances
Instance 0 : Conducted in assessment centre, April 2009 to September 2010.
70,630 participants, 70,630 items
| Maximum | 513.983 |
| Decile 9 | 101.66 |
| Decile 8 | 84.5104 |
| Decile 7 | 73.7114 |
| Decile 6 | 65.3042 |
| Median | 57.6278 |
| Decile 4 | 50.4554 |
| Decile 3 | 43.0332 |
| Decile 2 | 34.8001 |
| Decile 1 | 24.9047 |
| Minimum | 0 |
|

|
- Mean = 61.4923
- Std.dev = 31.6861
- 316 items above graph maximum of 178.414
|
Instance 1 : On-line cycle 1, February 2011 to April 2011.
100,447 participants, 100,447 items
| Maximum | 385.212 |
| Decile 9 | 99.4364 |
| Decile 8 | 83.2471 |
| Decile 7 | 72.9417 |
| Decile 6 | 64.7565 |
| Median | 57.4221 |
| Decile 4 | 50.4041 |
| Decile 3 | 43.2237 |
| Decile 2 | 35.3999 |
| Decile 1 | 25.9266 |
| Minimum | 0 |
|

|
- Mean = 60.9437
- Std.dev = 30.0128
- 423 items above graph maximum of 172.946
|
Instance 2 : On-line cycle 2, June 2011 to September 2011.
83,140 participants, 83,140 items
| Maximum | 519.832 |
| Decile 9 | 97.1344 |
| Decile 8 | 81.5494 |
| Decile 7 | 71.2963 |
| Decile 6 | 63.0869 |
| Median | 55.8655 |
| Decile 4 | 49.0114 |
| Decile 3 | 42.0929 |
| Decile 2 | 34.4631 |
| Decile 1 | 25.4447 |
| Minimum | 0 |
|

|
- Mean = 59.5832
- Std.dev = 29.7398
- 383 items above graph maximum of 168.824
|
Instance 3 : On-line cycle 3, October 2011 to December 2011.
103,616 participants, 103,616 items
| Maximum | 413.779 |
| Decile 9 | 96.5192 |
| Decile 8 | 80.9927 |
| Decile 7 | 71.1167 |
| Decile 6 | 63.0824 |
| Median | 55.9548 |
| Decile 4 | 49.0057 |
| Decile 3 | 42.0266 |
| Decile 2 | 34.4055 |
| Decile 1 | 25.2165 |
| Minimum | 0 |
|
|
- Mean = 59.297
- Std.dev = 29.1968
- 431 items above graph maximum of 167.822
|
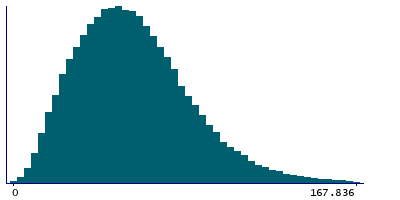
Instance 4 : On-line cycle 4, April 2012 to June 2012.
100,094 participants, 100,094 items
| Maximum | 539.499 |
| Decile 9 | 96.8711 |
| Decile 8 | 81.3114 |
| Decile 7 | 71.2152 |
| Decile 6 | 63.213 |
| Median | 56.0843 |
| Decile 4 | 49.2482 |
| Decile 3 | 42.2514 |
| Decile 2 | 34.6361 |
| Decile 1 | 25.6164 |
| Minimum | 0 |
|

|
- Mean = 59.613
- Std.dev = 29.4702
- 447 items above graph maximum of 168.126
|
