Data
457,927 items of data are available, covering 210,739 participants.
Defined-instances run from 0 to 4, labelled using Instancing
1.
Units of measurement are mg.
| Maximum | 393.818 |
| Decile 9 | 54.7511 |
| Decile 8 | 47.7096 |
| Decile 7 | 43.279 |
| Decile 6 | 39.8105 |
| Median | 36.7638 |
| Decile 4 | 33.8031 |
| Decile 3 | 30.6916 |
| Decile 2 | 27.1511 |
| Decile 1 | 22.4273 |
| Minimum | 0 |
|

|
- Mean = 38.0604
- Std.dev = 13.5975
- 2340 items above graph maximum of 87.0749
|
5 Instances
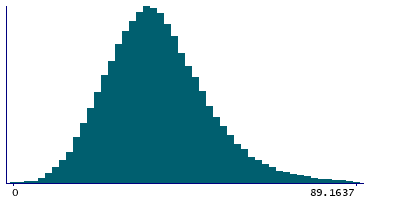
Instance 0 : Conducted in assessment centre, April 2009 to September 2010.
70,630 participants, 70,630 items
| Maximum | 393.818 |
| Decile 9 | 55.3489 |
| Decile 8 | 48.0265 |
| Decile 7 | 43.3669 |
| Decile 6 | 39.6958 |
| Median | 36.4842 |
| Decile 4 | 33.4211 |
| Decile 3 | 30.1607 |
| Decile 2 | 26.4471 |
| Decile 1 | 21.5342 |
| Minimum | 0 |
|
|
- Mean = 37.9089
- Std.dev = 14.379
- 396 items above graph maximum of 89.1636
|
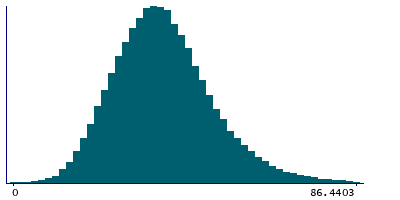
Instance 1 : On-line cycle 1, February 2011 to April 2011.
100,447 participants, 100,447 items
| Maximum | 267.84 |
| Decile 9 | 54.559 |
| Decile 8 | 47.6598 |
| Decile 7 | 43.3551 |
| Decile 6 | 39.9099 |
| Median | 36.9089 |
| Decile 4 | 33.9403 |
| Decile 3 | 30.8477 |
| Decile 2 | 27.3121 |
| Decile 1 | 22.6714 |
| Minimum | 0 |
|
|
- Mean = 38.1164
- Std.dev = 13.3654
- 504 items above graph maximum of 86.4466
|
Instance 2 : On-line cycle 2, June 2011 to September 2011.
83,140 participants, 83,140 items
| Maximum | 375.103 |
| Decile 9 | 55.3126 |
| Decile 8 | 48.0525 |
| Decile 7 | 43.5625 |
| Decile 6 | 40.1184 |
| Median | 37.0206 |
| Decile 4 | 34.0726 |
| Decile 3 | 30.9774 |
| Decile 2 | 27.3698 |
| Decile 1 | 22.6767 |
| Minimum | 0 |
|

|
- Mean = 38.3935
- Std.dev = 13.788
- 470 items above graph maximum of 87.9484
|
Instance 3 : On-line cycle 3, October 2011 to December 2011.
103,616 participants, 103,616 items
| Maximum | 259.256 |
| Decile 9 | 54.0372 |
| Decile 8 | 47.1797 |
| Decile 7 | 42.8474 |
| Decile 6 | 39.4549 |
| Median | 36.4671 |
| Decile 4 | 33.5515 |
| Decile 3 | 30.5277 |
| Decile 2 | 27.0715 |
| Decile 1 | 22.4303 |
| Minimum | 0 |
|

|
- Mean = 37.6971
- Std.dev = 13.1537
- 461 items above graph maximum of 85.6441
|
Instance 4 : On-line cycle 4, April 2012 to June 2012.
100,094 participants, 100,094 items
| Maximum | 286.088 |
| Decile 9 | 54.8585 |
| Decile 8 | 47.8172 |
| Decile 7 | 43.372 |
| Decile 6 | 39.9275 |
| Median | 36.8991 |
| Decile 4 | 33.9523 |
| Decile 3 | 30.8642 |
| Decile 2 | 27.3465 |
| Decile 1 | 22.6488 |
| Minimum | 0 |
|

|
- Mean = 38.2103
- Std.dev = 13.5437
- 500 items above graph maximum of 87.0683
|
