Data
457,927 items of data are available, covering 210,739 participants.
Defined-instances run from 0 to 4, labelled using Instancing
1.
Units of measurement are g.
| Maximum | 59.2221 |
| Decile 9 | 4.8565 |
| Decile 8 | 3.4 |
| Decile 7 | 2.63976 |
| Decile 6 | 1.90744 |
| Median | 1.51125 |
| Decile 4 | 1.20559 |
| Decile 3 | 0.667013 |
| Decile 2 | 0.232048 |
| Decile 1 | 0.048024 |
| Minimum | 0 |
|
|
- Mean = 2.33405
- Std.dev = 3.52173
- 10805 items above graph maximum of 9.66498
|
5 Instances
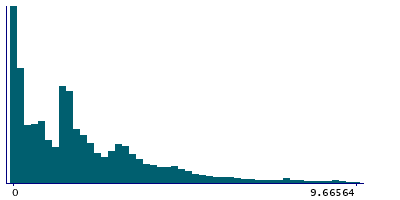
Instance 0 : Conducted in assessment centre, April 2009 to September 2010.
70,630 participants, 70,630 items
| Maximum | 51.0605 |
| Decile 9 | 4.857 |
| Decile 8 | 3.37765 |
| Decile 7 | 2.6 |
| Decile 6 | 1.8265 |
| Median | 1.45863 |
| Decile 4 | 1.032 |
| Decile 3 | 0.5205 |
| Decile 2 | 0.14875 |
| Decile 1 | 0.024012 |
| Minimum | 0 |
|
|
- Mean = 2.27783
- Std.dev = 3.53101
- 1651 items above graph maximum of 9.68999
|
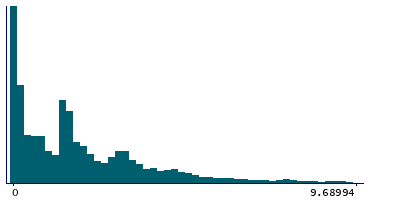
Instance 1 : On-line cycle 1, February 2011 to April 2011.
100,447 participants, 100,447 items
| Maximum | 49.3825 |
| Decile 9 | 4.94588 |
| Decile 8 | 3.48625 |
| Decile 7 | 2.72912 |
| Decile 6 | 1.96394 |
| Median | 1.54884 |
| Decile 4 | 1.287 |
| Decile 3 | 0.721818 |
| Decile 2 | 0.27102 |
| Decile 1 | 0.060012 |
| Minimum | 0 |
|
|
- Mean = 2.37801
- Std.dev = 3.46318
- 2248 items above graph maximum of 9.83174
|
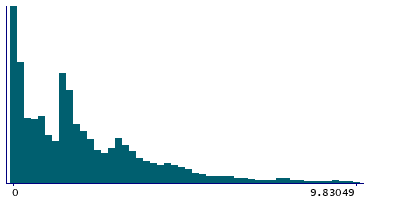
Instance 2 : On-line cycle 2, June 2011 to September 2011.
83,140 participants, 83,140 items
| Maximum | 50.6214 |
| Decile 9 | 4.8375 |
| Decile 8 | 3.3641 |
| Decile 7 | 2.64363 |
| Decile 6 | 1.904 |
| Median | 1.51125 |
| Decile 4 | 1.27425 |
| Decile 3 | 0.6963 |
| Decile 2 | 0.236994 |
| Decile 1 | 0.048024 |
| Minimum | 0 |
|

|
- Mean = 2.33444
- Std.dev = 3.51515
- 1958 items above graph maximum of 9.62698
|
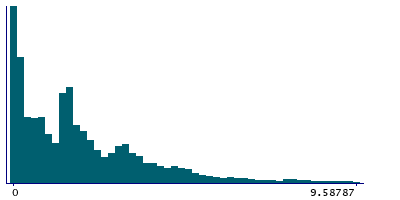
Instance 3 : On-line cycle 3, October 2011 to December 2011.
103,616 participants, 103,616 items
| Maximum | 54.3445 |
| Decile 9 | 4.821 |
| Decile 8 | 3.4 |
| Decile 7 | 2.57709 |
| Decile 6 | 1.88413 |
| Median | 1.50099 |
| Decile 4 | 1.121 |
| Decile 3 | 0.637717 |
| Decile 2 | 0.24 |
| Decile 1 | 0.055 |
| Minimum | 0 |
|
|
- Mean = 2.31918
- Std.dev = 3.53706
- 2523 items above graph maximum of 9.587
|
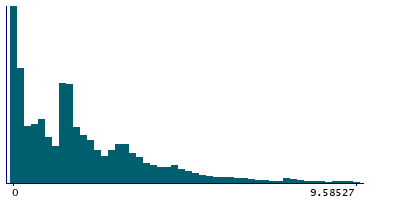
Instance 4 : On-line cycle 4, April 2012 to June 2012.
100,094 participants, 100,094 items
| Maximum | 59.2221 |
| Decile 9 | 4.81546 |
| Decile 8 | 3.38451 |
| Decile 7 | 2.62771 |
| Decile 6 | 1.91201 |
| Median | 1.51475 |
| Decile 4 | 1.269 |
| Decile 3 | 0.703125 |
| Decile 2 | 0.243194 |
| Decile 1 | 0.04825 |
| Minimum | 0 |
|
|
- Mean = 2.34467
- Std.dev = 3.56212
- 2419 items above graph maximum of 9.58267
|
