Data
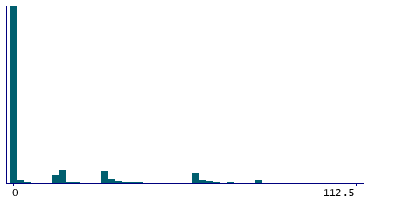
457,927 items of data are available, covering 210,739 participants.
Defined-instances run from 0 to 4, labelled using Instancing
1.
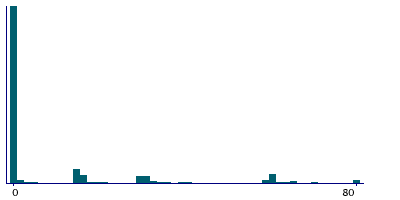
Units of measurement are g.
| Maximum | 435 |
| Decile 9 | 56.25 |
| Decile 8 | 16.25 |
| Decile 7 | 1.25 |
| Decile 6 | 0 |
| Median | 0 |
| Decile 4 | 0 |
| Decile 3 | 0 |
| Decile 2 | 0 |
| Decile 1 | 0 |
| Minimum | 0 |
|
|
- Mean = 11.7879
- Std.dev = 25.0841
- 5196 items above graph maximum of 112.5
|
5 Instances
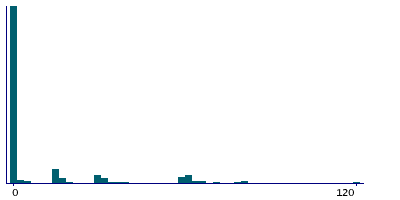
Instance 0 : Conducted in assessment centre, April 2009 to September 2010.
70,630 participants, 70,630 items
| Maximum | 435 |
| Decile 9 | 60 |
| Decile 8 | 15 |
| Decile 7 | 0 |
| Decile 6 | 0 |
| Median | 0 |
| Decile 4 | 0 |
| Decile 3 | 0 |
| Decile 2 | 0 |
| Decile 1 | 0 |
| Minimum | 0 |
|
|
- Mean = 11.4117
- Std.dev = 25.1168
- 621 items above graph maximum of 120
|
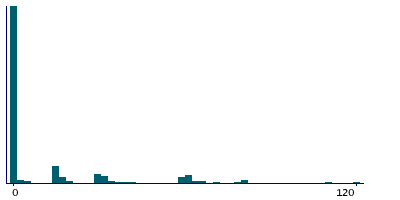
Instance 1 : On-line cycle 1, February 2011 to April 2011.
100,447 participants, 100,447 items
| Maximum | 420 |
| Decile 9 | 60 |
| Decile 8 | 20 |
| Decile 7 | 5 |
| Decile 6 | 0 |
| Median | 0 |
| Decile 4 | 0 |
| Decile 3 | 0 |
| Decile 2 | 0 |
| Decile 1 | 0 |
| Minimum | 0 |
|
|
- Mean = 13.0158
- Std.dev = 26.6716
- 1051 items above graph maximum of 120
|
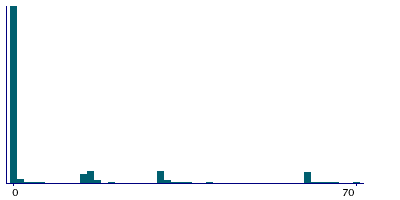
Instance 2 : On-line cycle 2, June 2011 to September 2011.
83,140 participants, 83,140 items
| Maximum | 420 |
| Decile 9 | 35 |
| Decile 8 | 15 |
| Decile 7 | 0 |
| Decile 6 | 0 |
| Median | 0 |
| Decile 4 | 0 |
| Decile 3 | 0 |
| Decile 2 | 0 |
| Decile 1 | 0 |
| Minimum | 0 |
|
|
- Mean = 10.4713
- Std.dev = 22.4681
- 1602 items above graph maximum of 70
|
Instance 3 : On-line cycle 3, October 2011 to December 2011.
103,616 participants, 103,616 items
| Maximum | 425 |
| Decile 9 | 60 |
| Decile 8 | 17.5 |
| Decile 7 | 1.25 |
| Decile 6 | 0 |
| Median | 0 |
| Decile 4 | 0 |
| Decile 3 | 0 |
| Decile 2 | 0 |
| Decile 1 | 0 |
| Minimum | 0 |
|

|
- Mean = 12.4541
- Std.dev = 26.1432
- 1025 items above graph maximum of 120
|
Instance 4 : On-line cycle 4, April 2012 to June 2012.
100,094 participants, 100,094 items
| Maximum | 420 |
| Decile 9 | 40 |
| Decile 8 | 16.25 |
| Decile 7 | 0 |
| Decile 6 | 0 |
| Median | 0 |
| Decile 4 | 0 |
| Decile 3 | 0 |
| Decile 2 | 0 |
| Decile 1 | 0 |
| Minimum | 0 |
|
|
- Mean = 11.2252
- Std.dev = 24.2679
- 1542 items above graph maximum of 80
|
