Data
457,927 items of data are available, covering 210,739 participants.
Defined-instances run from 0 to 4, labelled using Instancing
1.
Units of measurement are g.
| Maximum | 1041 |
| Decile 9 | 72 |
| Decile 8 | 60 |
| Decile 7 | 0 |
| Decile 6 | 0 |
| Median | 0 |
| Decile 4 | 0 |
| Decile 3 | 0 |
| Decile 2 | 0 |
| Decile 1 | 0 |
| Minimum | 0 |
|

|
- Mean = 23.7773
- Std.dev = 45.5675
- 8532 items above graph maximum of 144
|
5 Instances
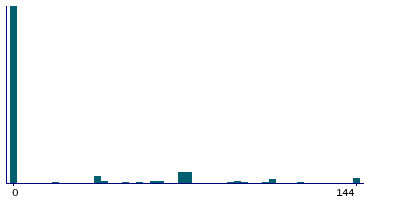
Instance 0 : Conducted in assessment centre, April 2009 to September 2010.
70,630 participants, 70,630 items
| Maximum | 786 |
| Decile 9 | 72 |
| Decile 8 | 60 |
| Decile 7 | 0 |
| Decile 6 | 0 |
| Median | 0 |
| Decile 4 | 0 |
| Decile 3 | 0 |
| Decile 2 | 0 |
| Decile 1 | 0 |
| Minimum | 0 |
|
|
- Mean = 22.4632
- Std.dev = 46.0027
- 1433 items above graph maximum of 144
|
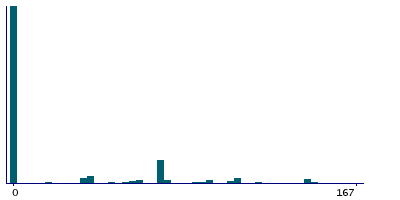
Instance 1 : On-line cycle 1, February 2011 to April 2011.
100,447 participants, 100,447 items
| Maximum | 642 |
| Decile 9 | 83.5 |
| Decile 8 | 72 |
| Decile 7 | 0 |
| Decile 6 | 0 |
| Median | 0 |
| Decile 4 | 0 |
| Decile 3 | 0 |
| Decile 2 | 0 |
| Decile 1 | 0 |
| Minimum | 0 |
|
|
- Mean = 24.35
- Std.dev = 45.8544
- 1610 items above graph maximum of 167
|
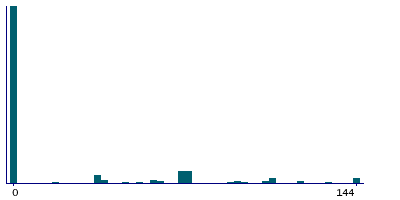
Instance 2 : On-line cycle 2, June 2011 to September 2011.
83,140 participants, 83,140 items
| Maximum | 570 |
| Decile 9 | 72 |
| Decile 8 | 60 |
| Decile 7 | 0 |
| Decile 6 | 0 |
| Median | 0 |
| Decile 4 | 0 |
| Decile 3 | 0 |
| Decile 2 | 0 |
| Decile 1 | 0 |
| Minimum | 0 |
|
|
- Mean = 23.6214
- Std.dev = 45.0665
- 1492 items above graph maximum of 144
|
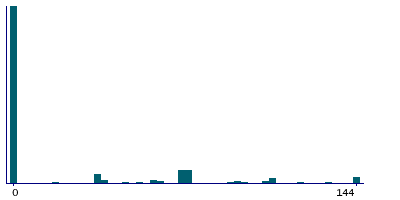
Instance 3 : On-line cycle 3, October 2011 to December 2011.
103,616 participants, 103,616 items
| Maximum | 740 |
| Decile 9 | 72 |
| Decile 8 | 72 |
| Decile 7 | 0 |
| Decile 6 | 0 |
| Median | 0 |
| Decile 4 | 0 |
| Decile 3 | 0 |
| Decile 2 | 0 |
| Decile 1 | 0 |
| Minimum | 0 |
|
|
- Mean = 24.142
- Std.dev = 45.4527
- 1853 items above graph maximum of 144
|
Instance 4 : On-line cycle 4, April 2012 to June 2012.
100,094 participants, 100,094 items
| Maximum | 1041 |
| Decile 9 | 72 |
| Decile 8 | 66 |
| Decile 7 | 0 |
| Decile 6 | 0 |
| Median | 0 |
| Decile 4 | 0 |
| Decile 3 | 0 |
| Decile 2 | 0 |
| Decile 1 | 0 |
| Minimum | 0 |
|

|
- Mean = 23.8819
- Std.dev = 45.4838
- 1865 items above graph maximum of 144
|
