Data
457,927 items of data are available, covering 210,739 participants.
Defined-instances run from 0 to 4, labelled using Instancing
1.
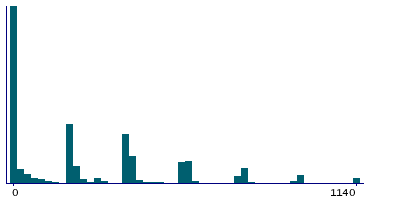
Units of measurement are g.
| Maximum | 2970 |
| Decile 9 | 570 |
| Decile 8 | 410 |
| Decile 7 | 380 |
| Decile 6 | 190 |
| Median | 190 |
| Decile 4 | 30 |
| Decile 3 | 0 |
| Decile 2 | 0 |
| Decile 1 | 0 |
| Minimum | 0 |
|

|
- Mean = 241.108
- Std.dev = 280.042
- 866 items above graph maximum of 1140
|
5 Instances
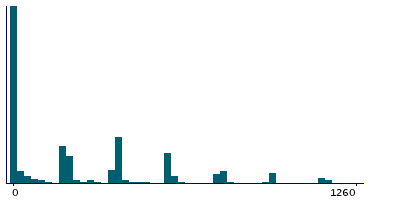
Instance 0 : Conducted in assessment centre, April 2009 to September 2010.
70,630 participants, 70,630 items
| Maximum | 2280 |
| Decile 9 | 630 |
| Decile 8 | 410 |
| Decile 7 | 380 |
| Decile 6 | 190 |
| Median | 190 |
| Decile 4 | 0 |
| Decile 3 | 0 |
| Decile 2 | 0 |
| Decile 1 | 0 |
| Minimum | 0 |
|
|
- Mean = 237.484
- Std.dev = 292.146
- 103 items above graph maximum of 1260
|
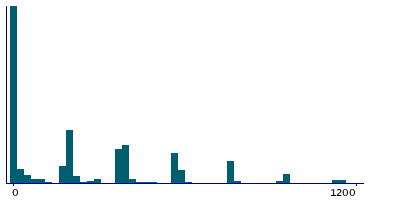
Instance 1 : On-line cycle 1, February 2011 to April 2011.
100,447 participants, 100,447 items
| Maximum | 2970 |
| Decile 9 | 600 |
| Decile 8 | 410 |
| Decile 7 | 380 |
| Decile 6 | 190 |
| Median | 190 |
| Decile 4 | 30 |
| Decile 3 | 0 |
| Decile 2 | 0 |
| Decile 1 | 0 |
| Minimum | 0 |
|
|
- Mean = 245.183
- Std.dev = 282.855
- 139 items above graph maximum of 1200
|
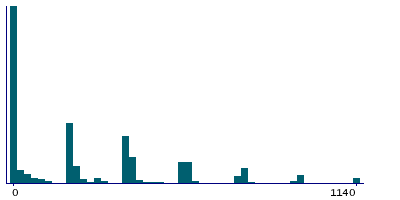
Instance 2 : On-line cycle 2, June 2011 to September 2011.
83,140 participants, 83,140 items
| Maximum | 2090 |
| Decile 9 | 570 |
| Decile 8 | 410 |
| Decile 7 | 380 |
| Decile 6 | 190 |
| Median | 190 |
| Decile 4 | 30 |
| Decile 3 | 0 |
| Decile 2 | 0 |
| Decile 1 | 0 |
| Minimum | 0 |
|
|
- Mean = 238.329
- Std.dev = 275.512
- 134 items above graph maximum of 1140
|
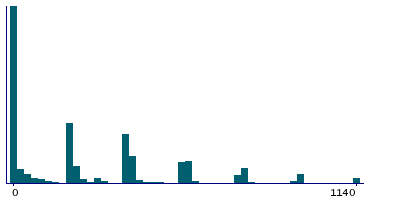
Instance 3 : On-line cycle 3, October 2011 to December 2011.
103,616 participants, 103,616 items
| Maximum | 1900 |
| Decile 9 | 570 |
| Decile 8 | 410 |
| Decile 7 | 380 |
| Decile 6 | 205 |
| Median | 190 |
| Decile 4 | 30 |
| Decile 3 | 0 |
| Decile 2 | 0 |
| Decile 1 | 0 |
| Minimum | 0 |
|
|
- Mean = 243.148
- Std.dev = 277.185
- 186 items above graph maximum of 1140
|
Instance 4 : On-line cycle 4, April 2012 to June 2012.
100,094 participants, 100,094 items
| Maximum | 2280 |
| Decile 9 | 570 |
| Decile 8 | 410 |
| Decile 7 | 380 |
| Decile 6 | 190 |
| Median | 190 |
| Decile 4 | 30 |
| Decile 3 | 0 |
| Decile 2 | 0 |
| Decile 1 | 0 |
| Minimum | 0 |
|
|
- Mean = 239.772
- Std.dev = 275.042
- 179 items above graph maximum of 1140
|
